from lec_utils import *
Welcome to Practical Data Science! 🎉
Agenda
- Who are we?
- What is data science?
- Course content and logistics.
- Example: Trends in baby names 👶.
Instructor: Suraj Rampure
Call me Suraj, pronounced "sooh-rudge".
- First year as faculty at the University of Michigan!
Go Blue! - Originally from Windsor, ON, Canada 🇨🇦.
- BS and MS in EECS from UC Berkeley 🐻.
- Just moved to Detroit from San Diego, where I taught data science for three years at UC San Diego.
Forgive me if I say "quarter" a lot – UCSD was on the quarter system!
- Outside interests: traveling, hiking, eating out, watching basketball, visiting my dog 🐶, etc.
 Pictures from my road trip from San Diego to Michigan, the Leaning Tower of Pisa in Italy, and Interlaken in Switzerland.
Course staff
In addition to the instructor, we have several staff members who are here to help you in discussion, office hours, and on Ed:
- 1 GSI: Nishant Kheterpal.
- 3 IAs: Kyle Hoffmeyer, Yutong Li, and Pranavi Pratapa.
- 2 graders: Neeru Uppalapati and Jingrui Zhuang.
Learn more about them at practicaldsc.org/staff.
After class today, come say hi to me and some of the TAs! We'll be at the tables in front of BBB in the diag from 3-4PM.
Please ask questions in lecture!
You're always free to ask questions during lecture, and I'll try and stop for them frequently. But still, you may not feel like asking your question out loud.
You can type your questions anonymously at the following link and I'll try and answer them.
practicaldsc.org/q
bookmark me!You'll also use this form to answer questions that I ask you during lecture.
You can also click the Lecture Questions link in the top-right corner of practicaldsc.org.

Question 🤔 (Answer at practicaldsc.org/q)
Select the FALSE statement below.
A. I have size 16 feet.
B. I skipped the first grade.
C. I was rejected by Michigan when I applied for undergrad.
D. Soulja Boy (the rapper) used to follow me on Twitter.
E. One of the TAs is older than me.
What is data science?
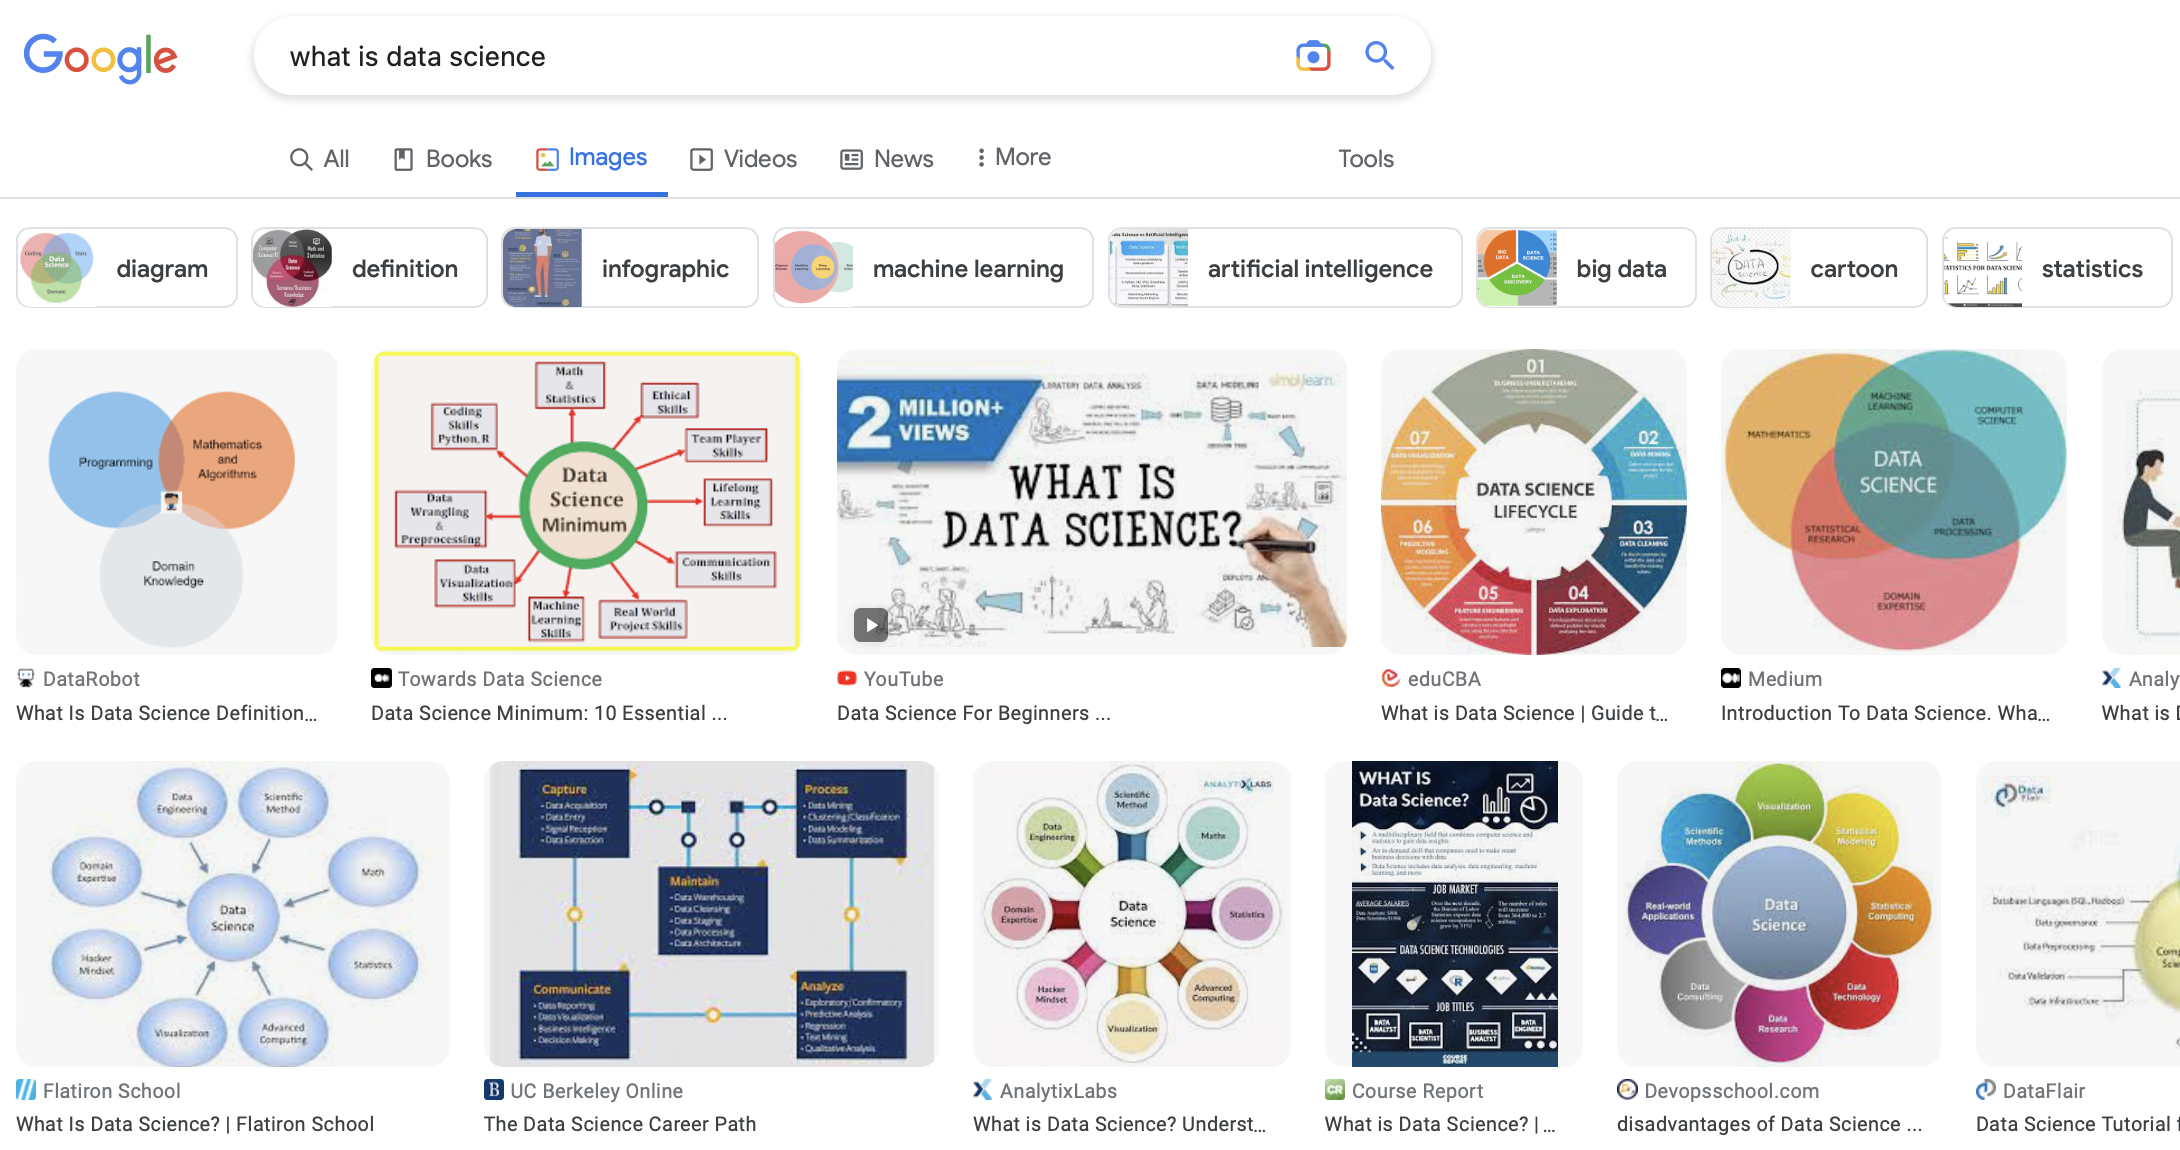
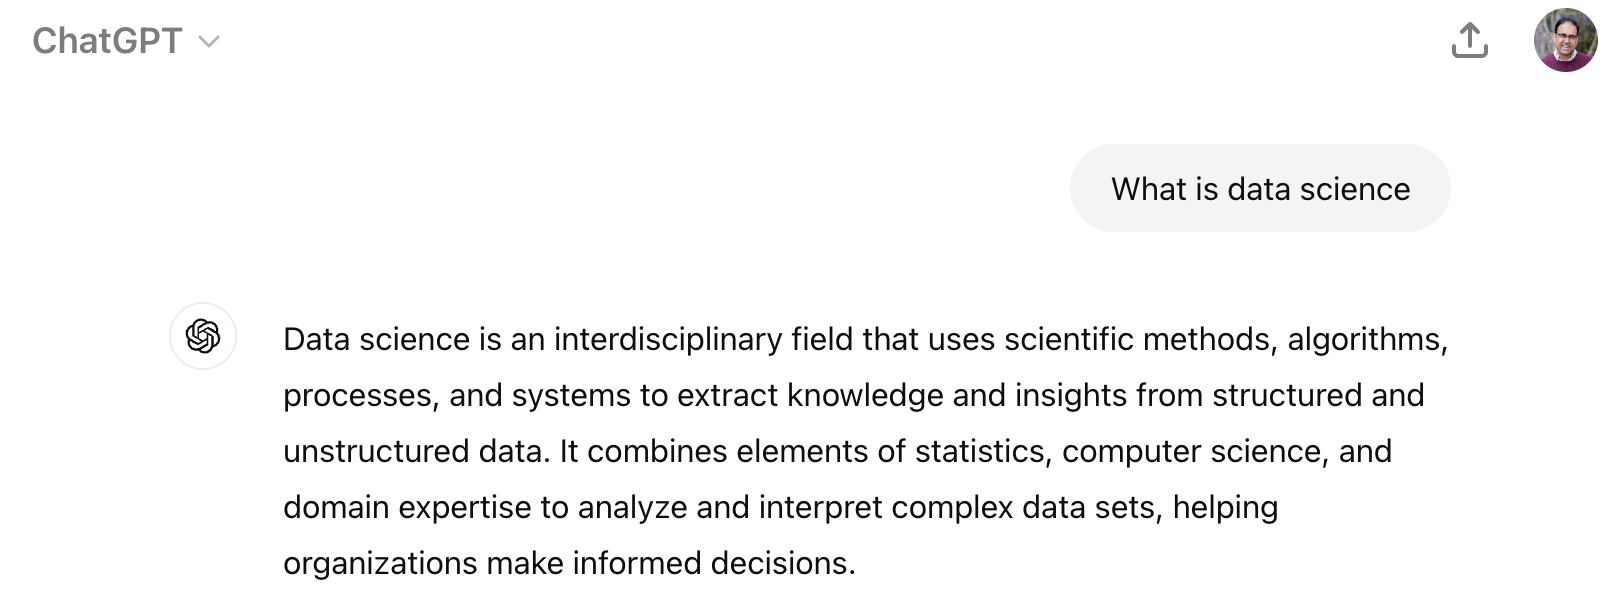
What is data science?
There isn't agreement on which "Venn Diagram" is correct!

- Why not? The field is new and rapidly developing.
- Make sure you're solid on the fundamentals, then find a niche that you enjoy.
- Read Taylor, Battle of the Data Science Venn Diagrams.
What does a data scientist do?
The chart below is taken from the 2016 Data Science Salary Survey, administered by O'Reilly. They asked respondents what they spend their time doing on a daily basis. What do you notice?

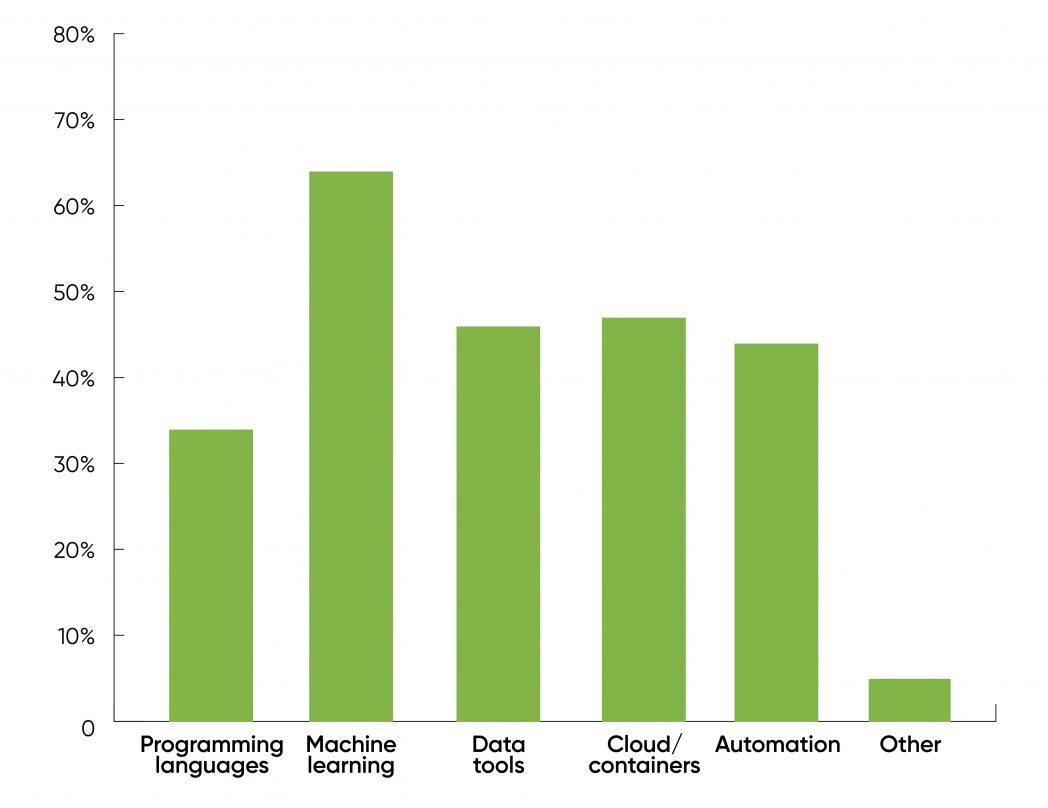
The chart below is taken from the followup 2021 Data/AI Salary Survey, also administered by O'Reilly. They asked respondents:
What technologies will have the biggest effect on compensation in the coming year?
What does a data scientist do?
My take: the job of a data scientist is to ask and answer questions using data.
This may sound simple, but asking the right questions can be hard, and answers can often be ambiguous – this uncertainty is what makes data science challenging!
Let's look at some examples of data science in practice.
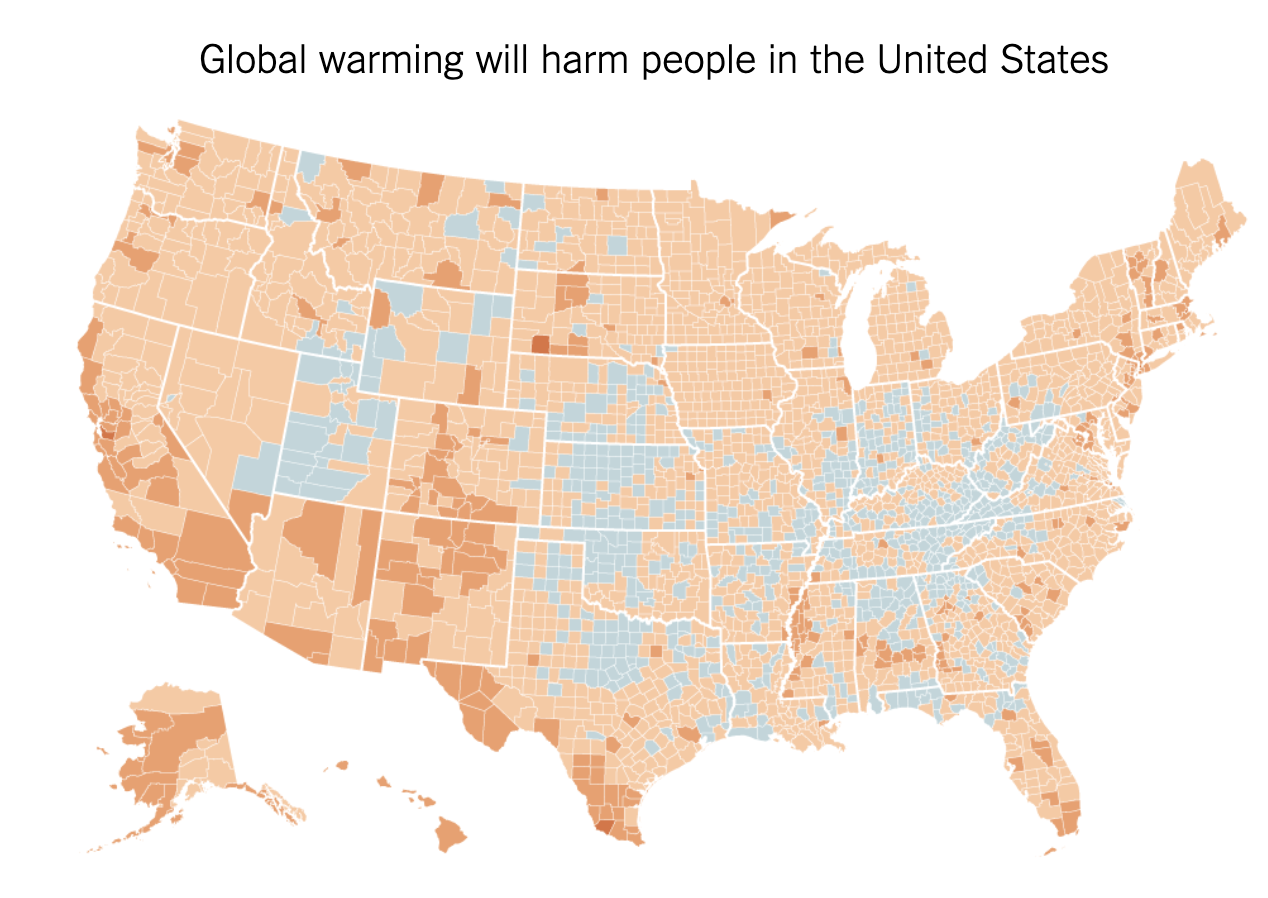
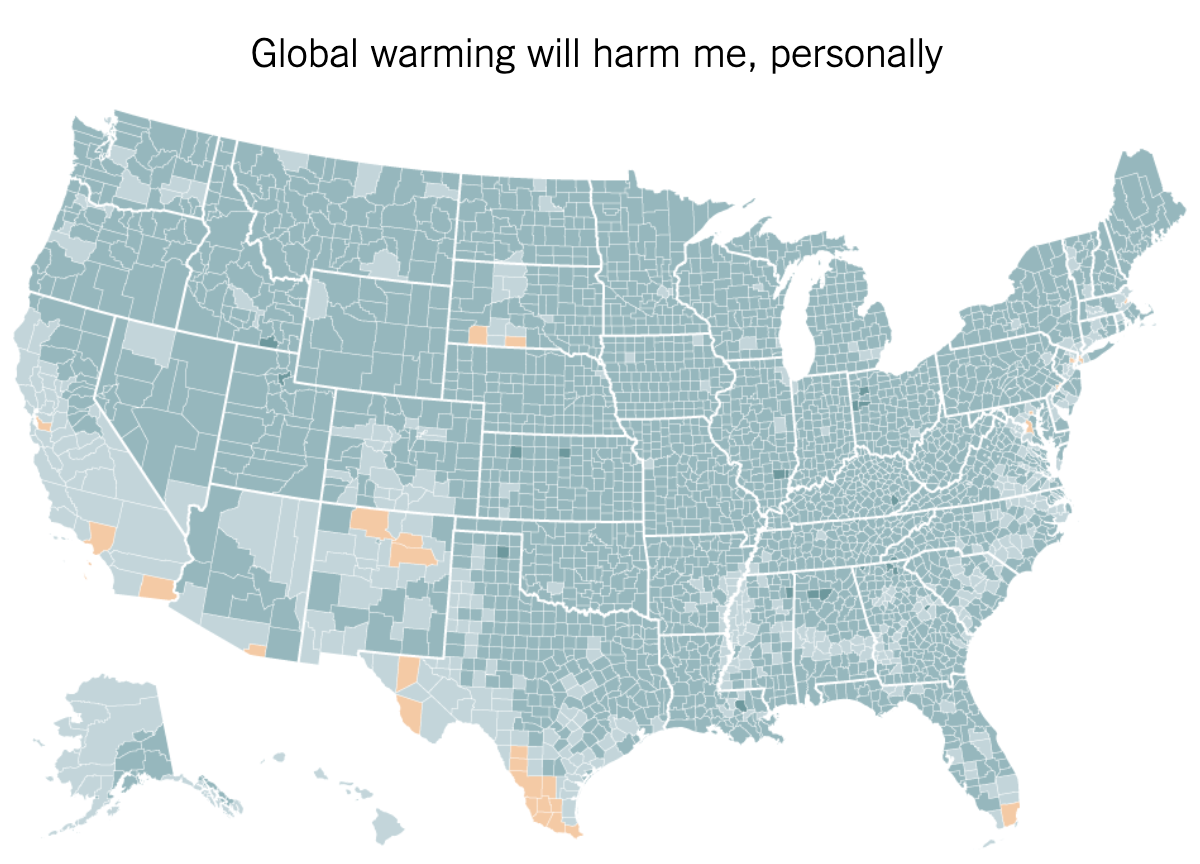
An excerpt from the article:
Global warming is precisely the kind of threat humans are awful at dealing with: a problem with enormous consequences over the long term, but little that is sharply visible on a personal level in the short term. Humans are hard-wired for quick fight-or-flight reactions in the face of an imminent threat, but not highly motivated to act against slow-moving and somewhat abstract problems, even if the challenges that they pose are ultimately dire.
Data science involves people 🧍
The decisions that we make as data scientists have the potential to impact the livelihoods of other people.
- Admissions and hiring.
- Hyper-personalized ad recommendations.
- Flu case forecasting.
The decisions you make as a data scientist go beyond the scope of your own computer!
What is this course really about, then?
- Good data analysis is not:
- A simple application of a statistics formula.
- A simple application of computer programs.
- There are many tools out there for data science, including Generative AI tools like ChatGPT, but they are merely tools. They don’t do any of the important thinking – that's where you come in!
Course content
Goals
After this course, you'll be able to start with raw data and come up with accurate, meaningful insights that you can share with others.
- You'll learn how to use industry-standard data manipulation tools.
And you'll need to rely on documentation, like a real data scientist!
- You'll also understand the inner-workings of complicated statistical models.
- Bigger picture, you'll practice turning vague ideas into concrete questions with quantitatively-measured answers.
- At the end of it all, you'll:
- Be prepared for internships and data science "take home" interviews.
- Be ready to create your own portfolio of personal projects.
- Have the background and maturity to succeed in more advanced data science-adjacent (databases, machine learning, etc.) courses.
Topics
- Week 1: Python and Jupyter Notebooks.
- Weeks 2-3:
numpy,pandas, and Exploratory Data Analysis. - Weeks 4-5: Missing Data; Web Scraping and APIs.
- Weeks 5-6: Text Processing.
- Week 7: Midterm Exam.
- Weeks 8-10: Linear Regression through Linear Algebra.
- Weeks 11-12: Generalization, Regularization, and Cross-Validation.
- Weeks 12-14: Gradient Descent and Logistic Regression.
- Weeks 15-16: Unsupervised Learning, Final Exam.
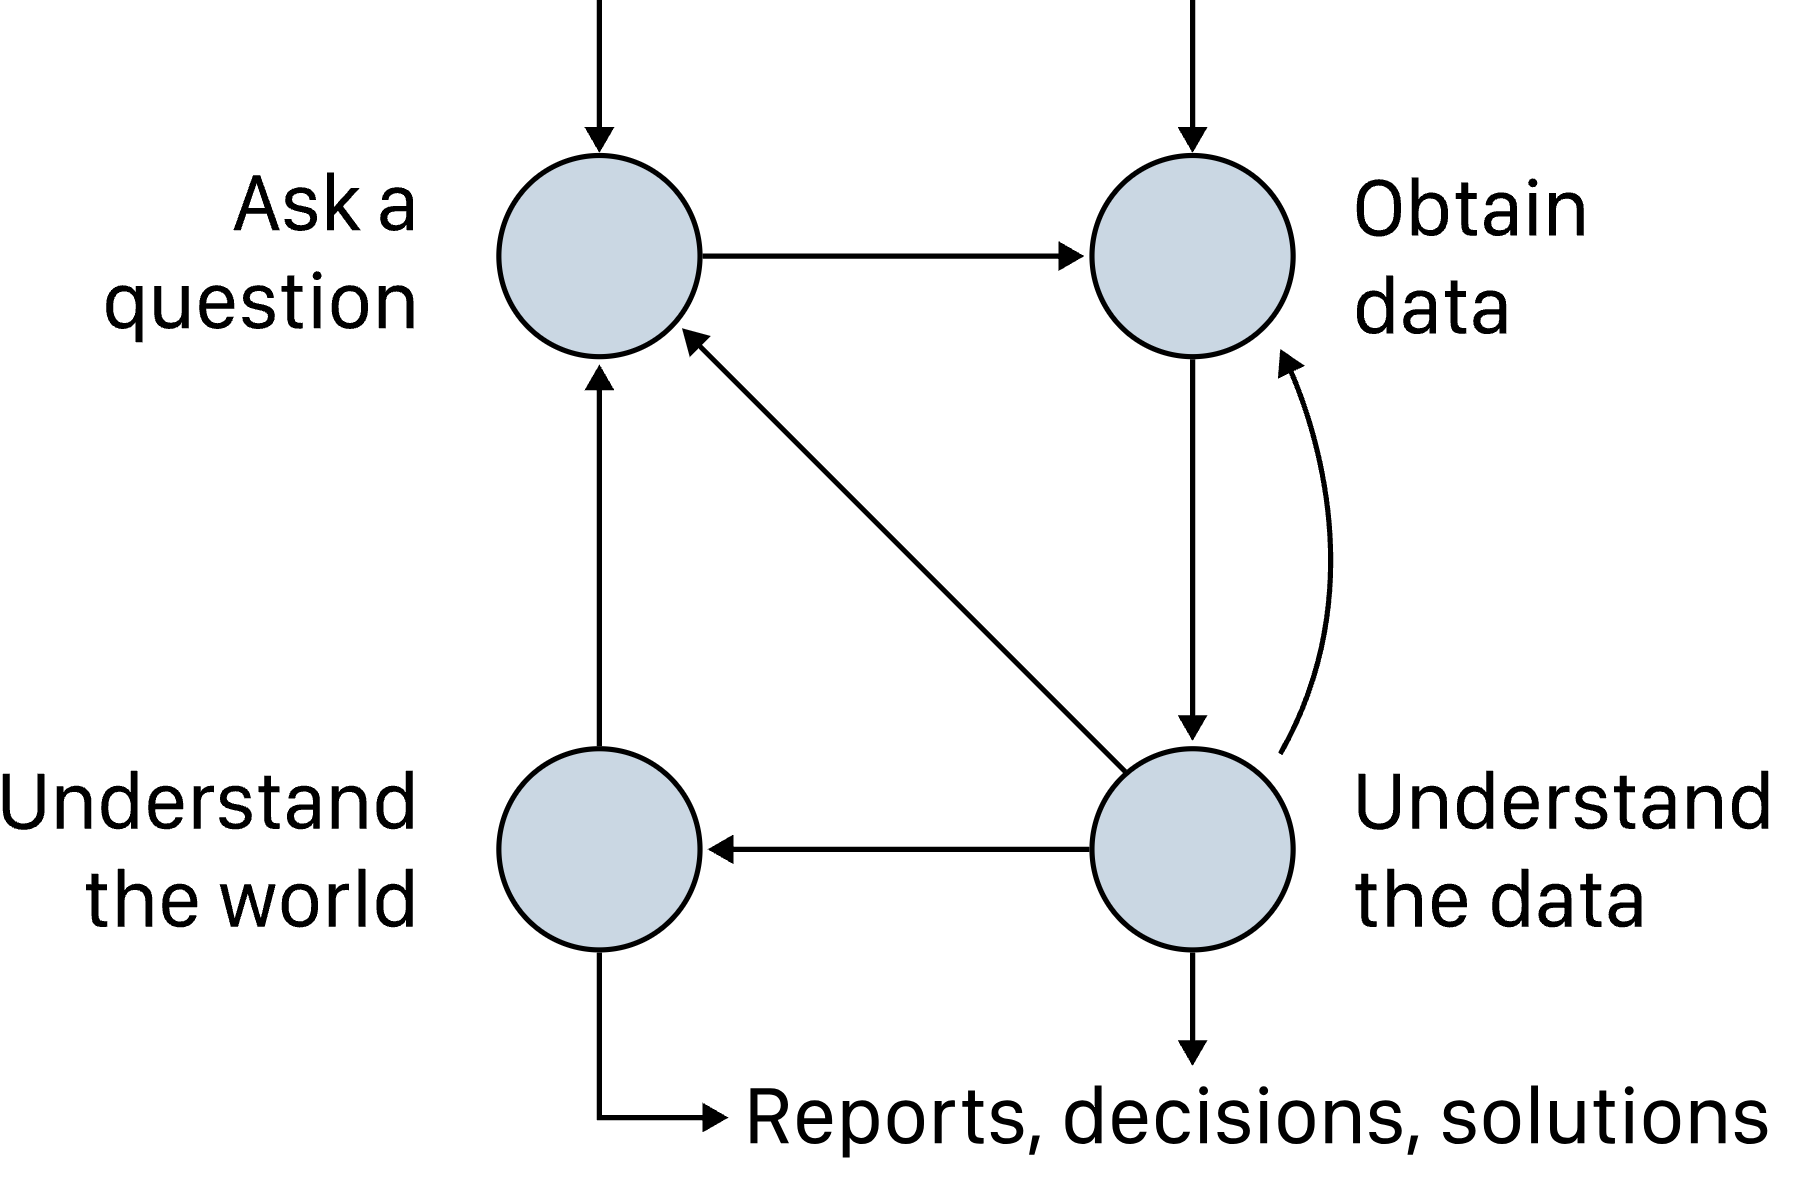
The data science lifecycle, which we'll refer to throughout the semester, shows the typical progression of a data science project.
Prerequisites
- The official prerequisites are programming (EECS 280), discrete math (EECS 203), calculus I and II, and linear algebra. An introductory statistics class is an advisory prerequisite.
- We will assume everyone has programmed before, seen some probability before, and is fluent with the basics of calculus and linear algebra.
- While we will rely on a background of linear algebra, we will point you to our new LARDS: Linear Algebra Review for Data Science when necessary.
- We're here to help!
Course logistics
Course website
The course website is your one-stop-shop for all things related to the course.
practicaldsc.org
Make sure to read the syllabus!
Getting set up
- Ed: Q&A forum. Must be active here, since this is where all announcements will be made.
- Gradescope: Where you will submit all assignments for autograding, and where all of your grades will live.
- Canvas: No ❌.
In addition, you must fill out our Welcome Survey by Monday, September 2nd to tell us more about yourself and whether you need an alternate exam.
Accessing course content on GitHub
You will access all course content by pulling the course GitHub repository:
We will post HTML versions of lecture notebooks on the course website, but otherwise you must git pull from this repository to access all course materials (including blank copies of assignments).
Environment setup
- You're required to set up a Python environment on your own computer.
- To do so, follow the instructions on the ⚙️ Environment Setup page of the course website ASAP (ideally before Thursday's class).
- Once you set up your environment, you will
git pullthe course repo every time a new assignment comes out. - Note: You will submit your work to Gradescope directly, without using Git.
- We'll help you with this in Discussion 1 on Friday if you get stuck.
Lectures
- Lectures are held in-person on Tuesdays and Thursdays from 1:30-3:00PM in 1500 EECS.
- Attendance is not required, but is encouraged. Lectures are recorded.
There may not be space in the first few lectures since the room is overenrolled... oops!
- Lecture notebooks will be posted on the course website ahead of time, both in the form of runnable code (in our GitHub repo) and as static HTML files, which you can annotate on your tablet if you'd like.
What's a notebook? You'll find out soon!
Discussions
- There are two discussion sections:
- Friday, 12:30-1:30PM, 2147 GGBL (capacity: 40).
- Friday, 2:30-3:30PM, 1670 BBB (capacity: 100).
- You can attend either discussion section, but if space fills up, priority will be given to students officially enrolled in that section.
- In Discussion 1, we'll make sure your programming environment is set up correctly and help you get started on Homework 1. In subsequent discussions, we'll take up solutions to old exam problems, which you'll work on in groups.
Homeworks
- In this course, you will learn the practice of data science by... practicing!
- There will be ~12 homework assignments due weekly throughout the semester, to be completed individually.
Each one is shorter than an EECS 280/281 project, but there are more of them – so expect a constant, moderate workload.
- Homework assignments will mostly involve writing Python code in Jupyter Notebooks, but may occasionally involve doing some pen-and-paper math and answering some free-response questions.
- Homeworks will come with public test cases that you can run locally, but ultimately you'll be graded using hidden test cases on Gradescope. We may also grade your code on style.
- Homeworks are usually due on Thursdays at 11:59PM. Your lowest score is dropped, and you have 6 slip days to use throughout the semester (max 2 per homework).
Exams
There are two in-person, on-paper exams, designed to (1) assess your understanding of the more theoretical concepts in the class and (2) make sure that you can write code independently.
- Midterm Exam (20%): Wednesday, October 9th, 7-9PM.
- Final Exam (30%): Thursday, December 12th, 4-6PM.
- Your Final Exam score can redeem your Midterm Exam score (see the Syllabus for details).
- Let us know on the Welcome Survey if you have a conflict.
- We will give you plenty of old exam problems to practice with.
A typical week
| Monday | Tuesday | Wednesday | Thursday | Friday |
|---|---|---|---|---|
| Lecture | Lecture | Discussion | ||
| Homework N - 1 due 11:59PM | Homework N released |
Resources
- Your main resource will be lecture notebooks.
- Many lectures will also have supplemental readings that come from:
- Learning Data Science, a textbook for UC Berkeley version of this course.
- notes.dsc80.com, lecture notes for (part of) the UCSD version of this course.
- You'll never be tested on something that appears in a supplemental reading but not in lecture/homework/discussion, but supplemental readings are still highly recommended!
Find an online resource that's useful? Send it to us and we'll link it on the website!
Caution ⚠️
This course will not be easy, because becoming fluent with working with data is hard!
- You will learn how to solve problems independently – documentation and the internet will be your friends.
I'm not going to tell you about every single Python feature in class!
- Learning how to effectively check your work and debug is extremely useful.
- Some tasks will be challenging, and you'll need to sit with them for a while. But, don't be afraid to ask for help!

Support 🫂
Once you've tried to solve problems on your own, we're glad to help.
- We have several office hours in person each week. These are mostly in-person on North Campus, but some are on Central Campus and some are remote. See the 📆 Calendar on the course website for details.
Come say hi, and come to sit and work on homeworks, even if you don't have any questions!
- Ed is your friend too. Make your conceptual questions public, and make your debugging questions private.
Collaboration, Academic Integrity, and Generative AI
- Make sure to read the Syllabus section on Collaboration and Academic Integrity.
- All homeworks are individual. Please discuss ideas and concepts with others, but no sharing code or posting code anywhere – collaboration must not result in solutions that are identifiably similar to other solutions, past or present.
- We trust that you're here to learn and do the work for yourself.
- We know that tools, like ChatGPT and GitHub Copilot, can write code for you. Feel free to use such tools with caution.
- You won't be able to use ChatGPT on the exams, which are in-person and on paper, so make sure you understand how your code actually works.
Data Science: The People's Science
We know students have enrolled in this course from a wide variety of backgrounds, and we're committed to helping everyone succeed.
from IPython.display import YouTubeVideo
YouTubeVideo('YMnqPTLoj7o')
Example: Trends in baby names 👶📈
Social Security's Top 10 Baby Names of 2023
The US Social Security Administration releases an article each year listing the most popular baby names.
from IPython.display import YouTubeVideo
YouTubeVideo('1HUjlpHI5us')
Let's see if we can verify these facts ourselves using raw data! Don't worry about any of the details here, just sit back and relax.
The data
What we're seeing below is a pandas DataFrame (fancy word for "table"). The DataFrame contains one row for every combination of 'Name', 'Sex', and 'Year'.
baby = pd.read_csv('data/baby.csv')
baby
| Name | Sex | Count | Year | |
|---|---|---|---|---|
| 0 | Liam | M | 20456 | 2022 |
| 1 | Noah | M | 18621 | 2022 |
| 2 | Olivia | F | 16573 | 2022 |
| ... | ... | ... | ... | ... |
| 2085155 | Wright | M | 5 | 1880 |
| 2085156 | York | M | 5 | 1880 |
| 2085157 | Zachariah | M | 5 | 1880 |
2085158 rows × 4 columns
For instance, it's telling us that in 2022, there were 16573 female babies born with the name Olivia. (We don't have information for 2023, sadly.)
Let's do some digging!
How many babies are in the dataset?
baby['Count'].sum()
365296191
How many babies were recorded in the dataset each year?
baby.groupby('Year')['Count'].sum()
Year
1880     201484
1881     192690
1882     221533
         ...
2020    3333981
2021    3379713
2022    3361896
Name: Count, Length: 143, dtype: int64
baby.groupby('Year')['Count'].sum().plot(title='Number of Babies Born Per Year')
What were the most common names in 2022?
def show_ten_most_common(df):
    return (
        df[df['Year'] == 2022]
        .groupby('Name')['Count']
        .sum()
        .sort_values(ascending=False)
        .head(10)
        .sort_values()
        .plot(kind='barh')
        .show()
    )
show_ten_most_common(baby)
Can we create the same chart, separately for male and female babies?
We can, easily, since we defined the function show_ten_most_common!
baby.groupby('Sex').apply(show_ten_most_common);
What about trends in individual names?
baby[baby['Name'] == 'Olivia']
| Name | Sex | Count | Year | |
|---|---|---|---|---|
| 2 | Olivia | F | 16573 | 2022 |
| 13017 | Olivia | M | 16 | 2022 |
| 31917 | Olivia | F | 17798 | 2021 |
| ... | ... | ... | ... | ... |
| 2079563 | Olivia | F | 52 | 1882 |
| 2081652 | Olivia | F | 51 | 1881 |
| 2083640 | Olivia | F | 44 | 1880 |
202 rows × 4 columns
(
    baby[baby['Name'] == 'Olivia']
    .groupby('Year')['Count']
    .sum()
    .plot(title='Number of Babies Born Named "Olivia" Per Year')
)
def name_graph(name):
    fig = (
        baby[baby['Name'] == name]
        .groupby('Year')['Count']
        .sum()
        .plot(title=f'Number of Babies Born Named "{name}" Per Year')
    )
    fig.show()
name_graph('Suraj')
What about your names?
from IPython.display import clear_output
from ipywidgets import widgets
# The first names of everyone in the class!
class_first = np.load('data/names-fa24.npy', allow_pickle=True)
class_first
array(['Abhinav', 'Adam', 'Aditi', ..., 'Yutong', 'Zachary', 'Zifei'],
      dtype='<U13')
dropdown_names = widgets.Dropdown(options=class_first, value='Suraj')

def dropdown_names_handler(change):
    if change['name'] == 'value' and (change['new'] != change['old']):
        clear_output()
        display(dropdown_names)
        name_graph(change['new'])

display(dropdown_names)
name_graph('Suraj')
dropdown_names.observe(dropdown_names_handler)
Dropdown(index=113, options=('Abhinav', 'Adam', 'Aditi', 'Aditya', 'Advay', 'Aileen', 'Akshay', 'Aksheet', 'Al…
This week...
- After class today, come hang out at the tables in front of BBB in the diag from 3-4PM with me and some of the TAs.
- On Thursday, you'll get your hands dirty with Jupyter Notebooks and Python.
- Follow the instructions in ⚙️ Environment Setup before Thursday's class so you can code along with me!
- Homework 1 will be released Friday morning; we'll help you get started in Friday's discussion.
- Fill out the Welcome Survey and read the Syllabus!
