from lec_utils import *
Lecture 1
Introduction
EECS 398: Practical Data Science, Spring 2025
practicaldsc.org • github.com/practicaldsc/sp25 • 📣 See latest announcements here on Ed
Welcome to Practical Data Science! 🎉
Instructor: Suraj Rampure; IA: Abhinav Attaluri
- Call me Suraj, pronounced "sooh-rudge".
Many students also call me "Prof. Suraj" or "Prof. Rampure" – all of these are fine!
- 30 second life story:
- Originally from Windsor, ON, Canada 🇨🇦.
- BS and MS in EECS from UC Berkeley 🐻.
- Taught data science at UC San Diego 🔱 from 2021-2024.
- Recently moved back to Metro Detroit; just finished first year as teaching faculty at the University of Michigan 〽️.
- We also have an IA – Abhinav Attaluri – who is here to help you in office hours, study sessions, and on Ed.
Learn more about us at practicaldsc.org/staff.
- One of the benefits of this being a small class is that we can all get to know each other very well – this is the value of a university education!

Please ask questions in lecture!
You're always free to ask questions during lecture, and I'll try and stop for them frequently. But still, you may not feel like asking your question out loud.
You can type your questions anonymously at the following link and I'll try and answer them.
practicaldsc.org/q
bookmark me!You'll also use this form to answer questions that I ask you during lecture.
You can also click the Lecture Questions link in the top-right corner of practicaldsc.org.
Question 🤔 (Answer at practicaldsc.org/q)
Select the FALSE statement below.
- A. I have size 16 feet.
- B. I skipped the first grade.
- C. I was rejected by Michigan when I applied for undergrad.
- D. Soulja Boy (the rapper) used to follow me on Twitter.
- E. I was an undergrad student during COVID.
Agenda 📆
- What is data science?
- Course logistics.
- The anatomy of Jupyter Notebooks.
- Example: Trends in baby names 👶.
What is data science?
What is data science?
- Whatever it is, it seems to be at the intersection of lots of different fields.
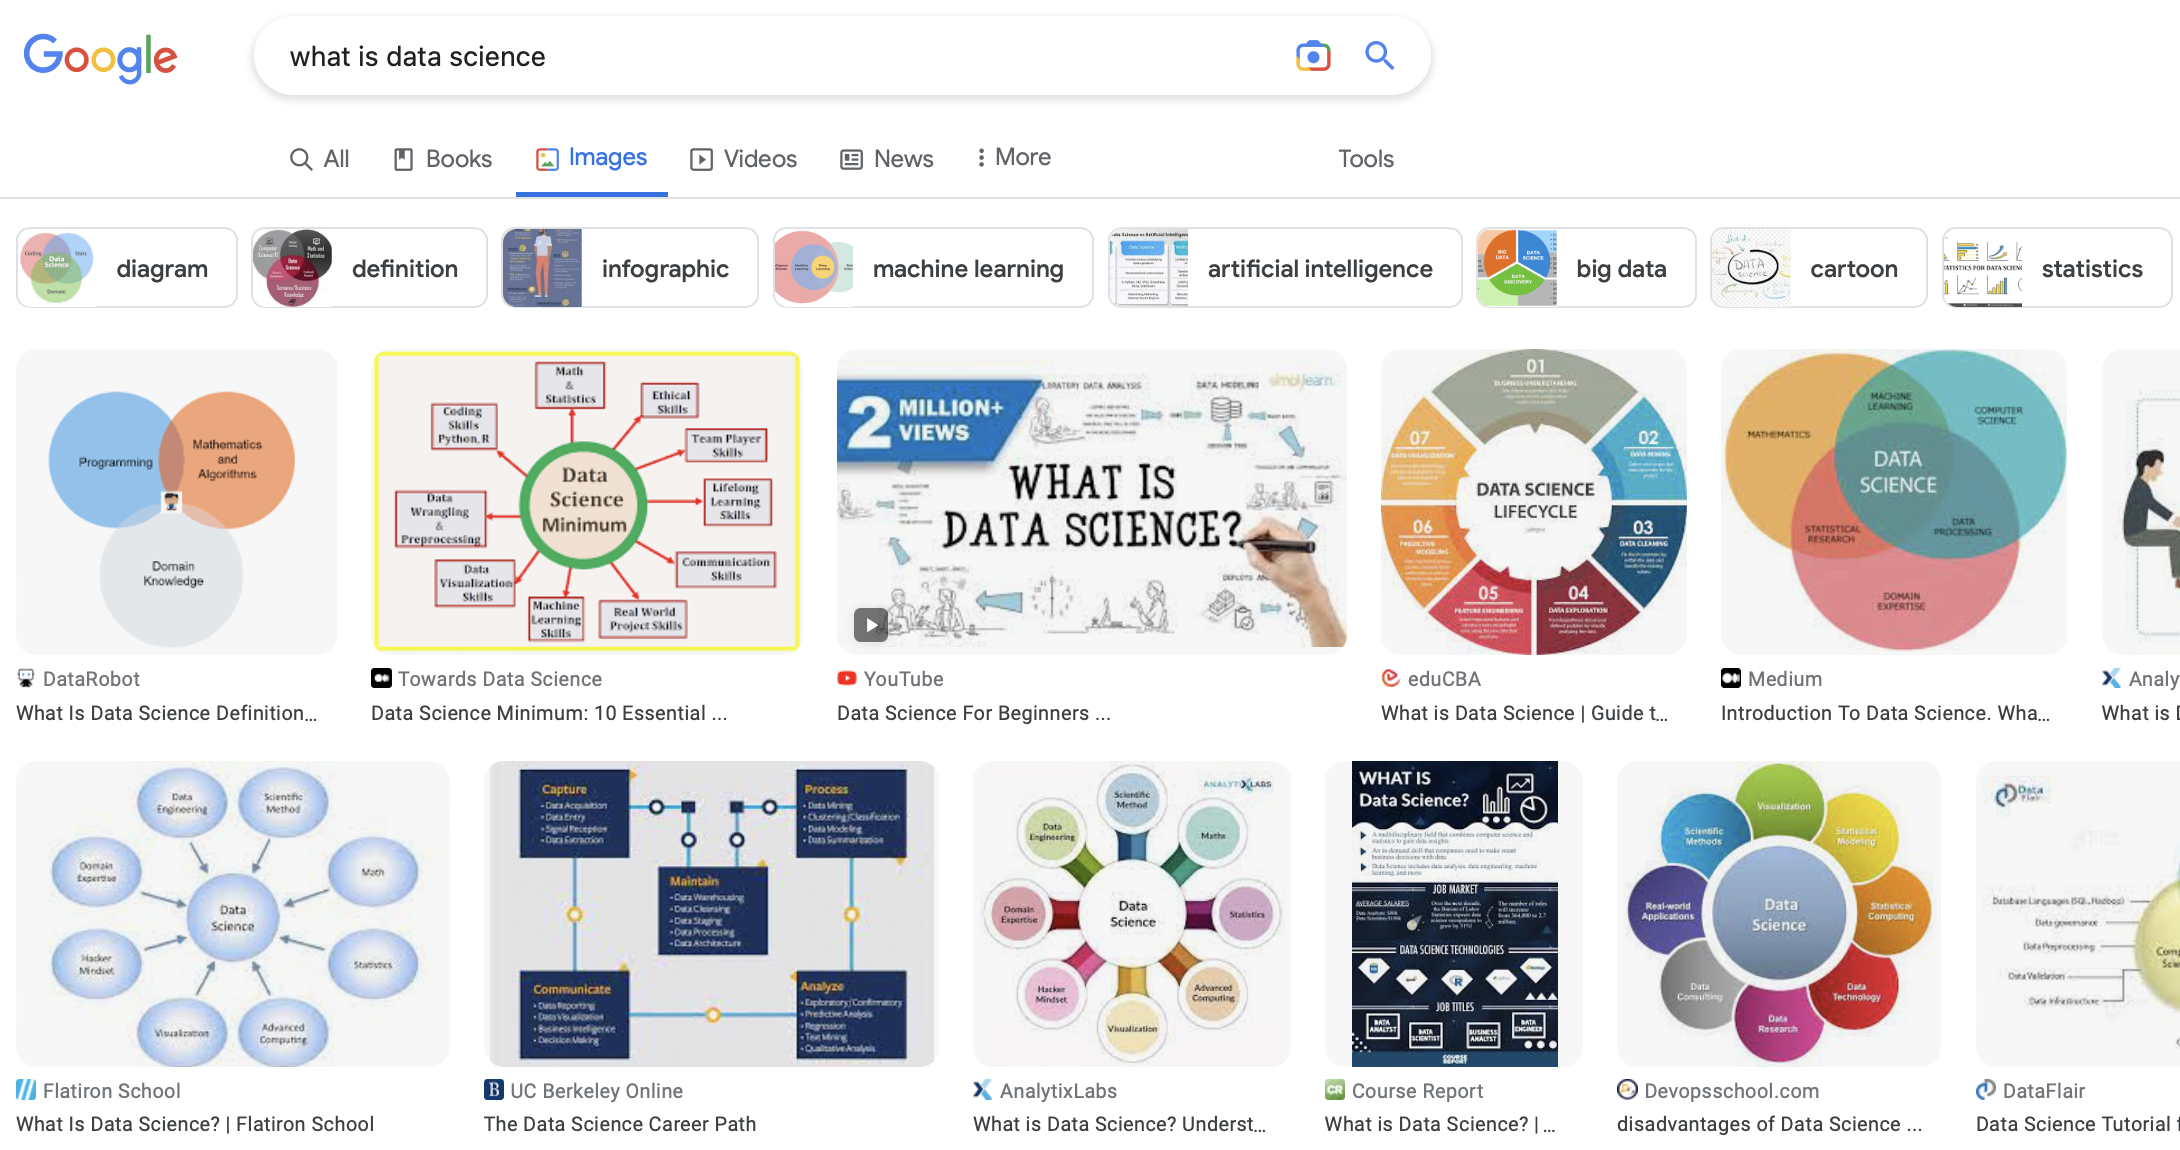
- It sounds like a hot, new term, but many of the core ideas in data science are hundreds of years old!
Linear regression, for example, was developed in the early 1800s.
Historical origins
- 1974: Peter Naur says data science is "The science of dealing with data, once they have been established, while the relation of the data to what they represent is delegated to other fields and sciences."
- 1997: C.F. Jeff Wu, a statistics and IOE professor at Michigan, says statistics should be renamed data science and statisticians should be renamed data scientists.
- 2010: Drew Conway publishes his famous Data Science Venn Diagram.
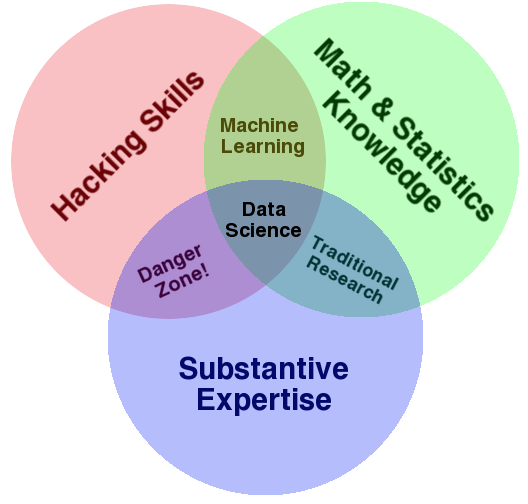 But there's no agreement on which "Venn diagram" is correct – see here!
- 2015: The US appoints D.J. Patil as its first Chief Data Scientist.
What is data science?
- Data science is such a new field that there's no one agreed upon definition of what it is.
Different universities take different stances, too – some universities have dedicated data science departments, some don't.
- My definition: the job of a data scientist is to ask and answer questions using data.
- This may sound simple, but asking the right questions can be hard, and answers can often be ambiguous. This uncertainty is what makes data science challenging!
Practice and theory
- In this course, you'll get a taste of the tools that data scientists in industry use every day.
Python,pandas,numpy,sklearn, etc.
- But, expect the course to be math heavy after the first 10 lectures.
 Lecture slide from last semester.
In this course, you'll end up building models that predict house prices:
>>> pipe_cv.predict(pd.DataFrame([{
                'Gr Liv Area': 2500,
                'Total Bsmt SF': 1500,
                'Neighborhood': 'CollgCr'
            }]))
            array([304362.63752408])
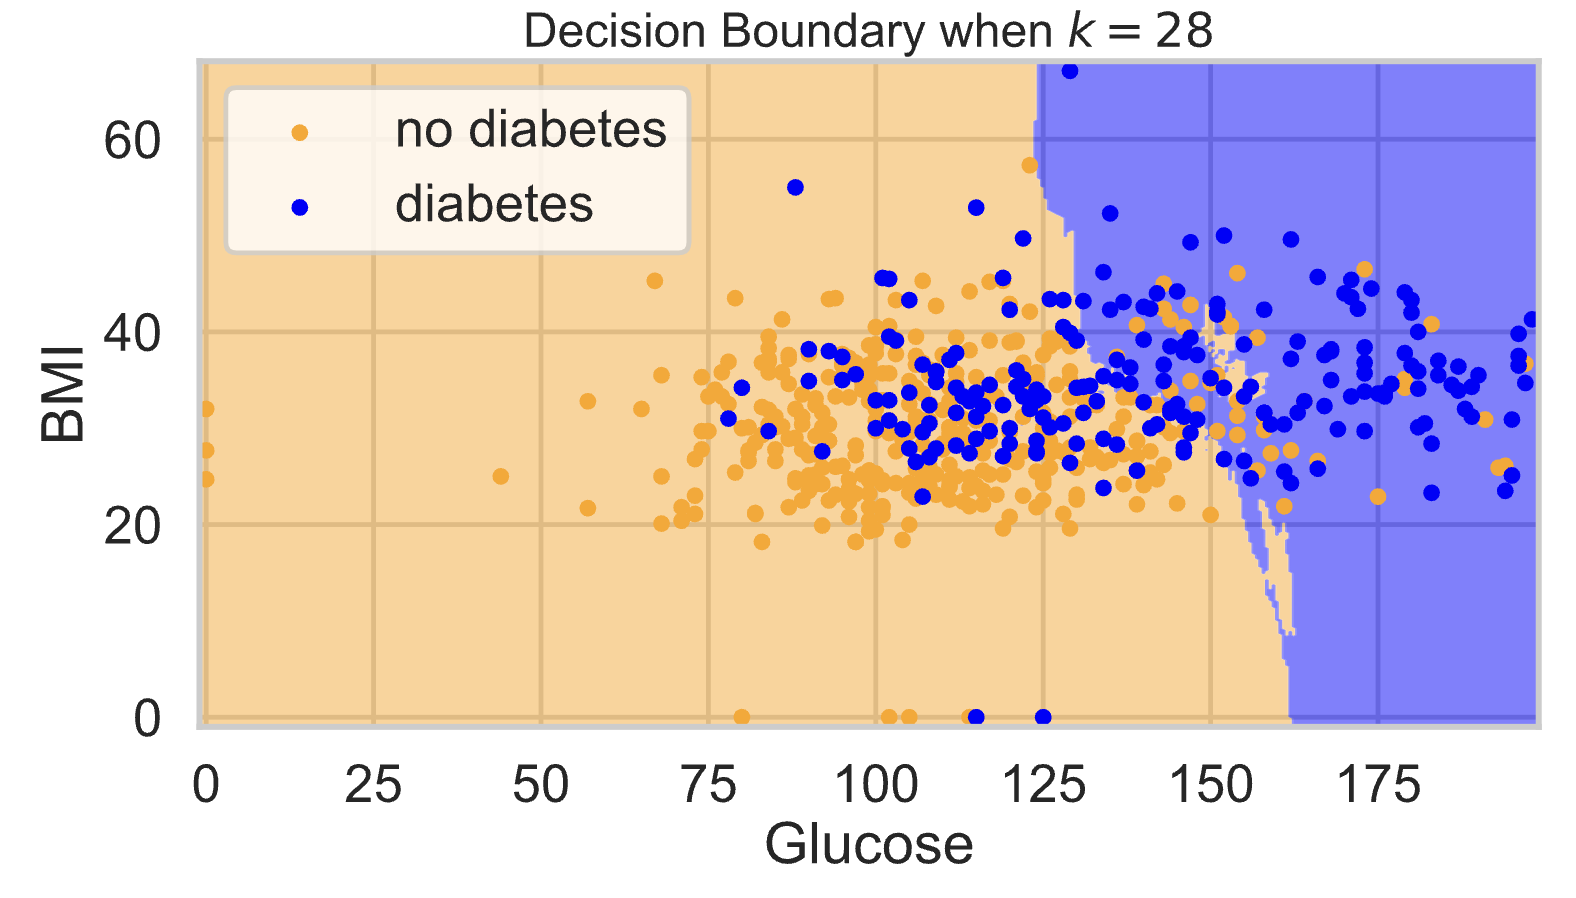
And whether patients have diabetes:
And whether a digit is a 0, 1, 2, 3, ..., or 9:
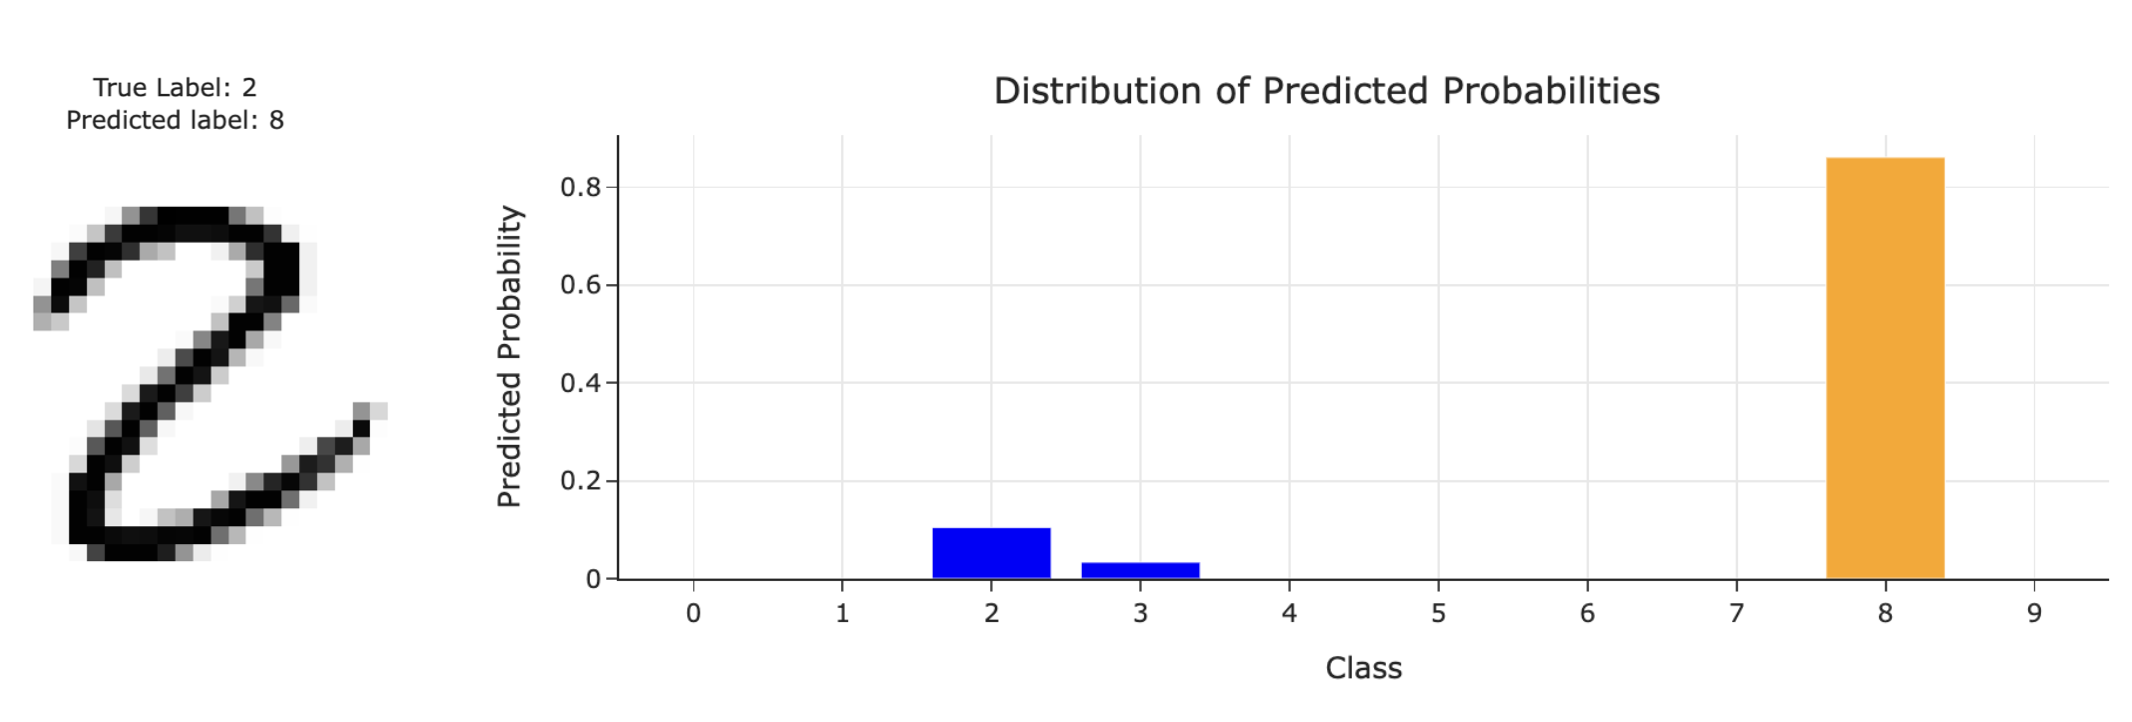
so that you know how to choose the right model for the job
and understand how they may fail.
Tools like ChatGPT are just tools. They don’t do any of the important thinking – that's where you come in!
Data science involves people 🧍
- The decisions that we make as data scientists have the potential to impact the livelihoods of other people.
- Example: Admissions and hiring.
- Example: Hyper-personalized ad recommendations.
- Example: Flu case forecasting.
- The decisions you make as a data scientist go beyond the scope of your own computer!
Goals
- After this course, you'll be able to start with raw data and come up with accurate, meaningful insights that you can share with others.
- You'll learn how to use industry-standard data manipulation tools.
And you'll need to rely on documentation, like a real data scientist!
- You'll also understand the inner workings of complicated machine learning models.
- At the end of it all, you'll:
- Be prepared for internships and data science "take home" interviews.
- Be ready to create your own portfolio of personal projects.
- Have the background and maturity to succeed in more advanced data science-adjacent (databases, machine learning, etc.) courses.
Prerequisites
- The official prerequisites are programming (EECS 280), discrete math (EECS 203), calculus I and II, and linear algebra. An introductory statistics class is an advisory prerequisite.
- We will assume everyone has programmed before, seen some probability before, and is fluent with the basics of calculus.
- If you haven't seen linear algebra before, we'll provide you review resources to get up to speed, but expect to do some self-studying.
- We're here to help!
Course logistics
Course website
- Make sure to read the syllabus!
Getting set up
- Ed: Q&A forum. Must be active here, since this is where all announcements will be made.
- Gradescope: Where you will submit all assignments for autograding, and where all of your grades will live.
- Canvas: No ❌.
- In addition, you must fill out our Welcome Survey by Friday, May 9th to tell us more about yourself, your availability this summer, and whether you need an alternate exam.
Accessing course content on GitHub
- You will access all course content by pulling the course GitHub repository:
- We will post HTML versions of lecture notebooks on the course website, but otherwise you must
git pullfrom this repository to access all course materials (including blank copies of assignments).
Environment setup
- You're required to set up a Python environment on your own computer.
- To do so, follow the instructions on the Environment Setup page of the course website ASAP.
It contains a walkthrough video, too.
- Once you set up your environment, you will
git pullthe course repo every time a new assignment comes out.
- Note: You will submit your work to Gradescope directly, without using Git.
- If you run into any trouble, I can help you after class, and you can also come to tomorrow's study session (more details soon).
Lectures
- Lectures are held in-person on Tuesdays and Thursdays from 2-5PM in 1690 BBB.
- On each day, we'll cover two 80-minute lectures, separated by a ~10 minute break.
On sunny days, we'll try and go outside!
- Attendance is not required, but is encouraged. Lectures are recorded.
- Lecture notebooks will be posted on the course website ahead of time, both in the form of runnable code (in our GitHub repo) and as static HTML files, which you can annotate on your tablet if you'd like.
What's a notebook? You'll find out soon!
- I will try to post all 4 lectures for the coming week on Sunday.
If you want to get a preview of what's next, you can look at last semester's lectures at practicaldsc.org/wn25.
Lecture resources
- Your main resource will be lecture notebooks.
- To accompany some lecture topics, we will post "Guides" on the course website that you're expected to read.
- Many lectures will also have supplemental readings, taken from various sources online.
Most of these are already listed on the homepage of the course website. Check out the Resources page for more.
- You'll never be tested on something that appears in a supplemental reading but not in lecture/guide/homework, but supplemental readings are still highly recommended!
Find an online resource that's useful? Send it to us and we'll link it on the website!
Study sessions 🆕
- In the discussion section slot – on Wednesdays from 2-4PM in 1690 BBB – we will be holding "study sessions", which are optional, drop-in group office hours held by the IA.
- There will usually be homework assignments due on Wednesdays, so study sessions are a great time to get last-minute help and work with others.
- These replace standard discussion sections, which in Fall/Winter were designed to give you practice with theoretical problems that will be on exams.
We think study sessions are a better use of the time in the Spring, given the frequency of assignment deadlines. More on exam prep soon!
Homeworks
- There will be 11 homework assignments due ~twice a week, to be completed individually.
Each one is shorter than an EECS 280/281 project, but there are more of them – so expect a constant, moderate workload.
- Homework assignments will involve a combination of writing Python code in Jupyter Notebooks and doing some pen-and-paper math.
- Homeworks will come with public test cases that you can run locally, but ultimately your code will be graded using hidden test cases on Gradescope.
- Your lowest 2 scores are dropped, and you have 8 slip days to use throughout the semester (max 2 per homework).
- The first two homeworks are already available; start working on Homework 1 after today's class!
- Homework 1 is due on Friday, May 9th.
- Homework 2 is due on Wednesday, May 14th.
Final Project
- In the Final Project, you’ll work on an open-ended investigation of a dataset of your choosing, using the tools from throughout the semester.
- Your work will culminate in a public-facing website that you can share with friends, family, and on your resume.
- See Fall 2024's submissions here.
- Unlike with homeworks, you can work with a partner and there is a checkpoint. More details to come.
Exams
- There are two in-person, on-paper exams, designed to:
- assess your understanding of the more theoretical concepts in the class, and
- make sure that you can write code independently.
- Midterm Exam (25%): Wednesday, May 28th, 2-4PM.
- Final Exam (25%): Tuesday, June 24th, 1:30-3:30PM.
- Let us know on the Welcome Survey if you have a conflict.
- The Study Site, study.practicaldsc.org, contains last year's exams, and has several topic-specific worksheets you should use to prepare for exams. Practice every single week!
Technical Interview 🆕
- The Technical Interview is an optional, pass/fail, 30 minute, in-person interview with me, covering content from Lectures 1-8.
- In the interview, you'll be presented with a dataset, and will be asked to write several lines of code to answer 5 verbal questions that are asked of you. You'll pass if you answer at least 4 of the 5 questions.
- If you don’t take the Technical Interview, or fail it (only one take allowed), the Midterm Exam will count for 25% of your overall course grade.
- If you pass the Technical Interview, the Midterm Exam will count for 15% of your overall course grade, and the Technical Interview will count for 10% of your overall course grade.
- Signups for Technical Interviews and practice interviews will open on May 16th.
See the Syllabus for dates.
Support 🫂
- We have several office hours each week, all of which are either remote or hybrid (in-person + remote).
See the Calendar on the course website for details.
Come say hi, and come to sit and work on homeworks, even if you don't have any questions!
- Ed is your friend too. Make your conceptual questions public, and make your debugging questions private.
- We're here to help!
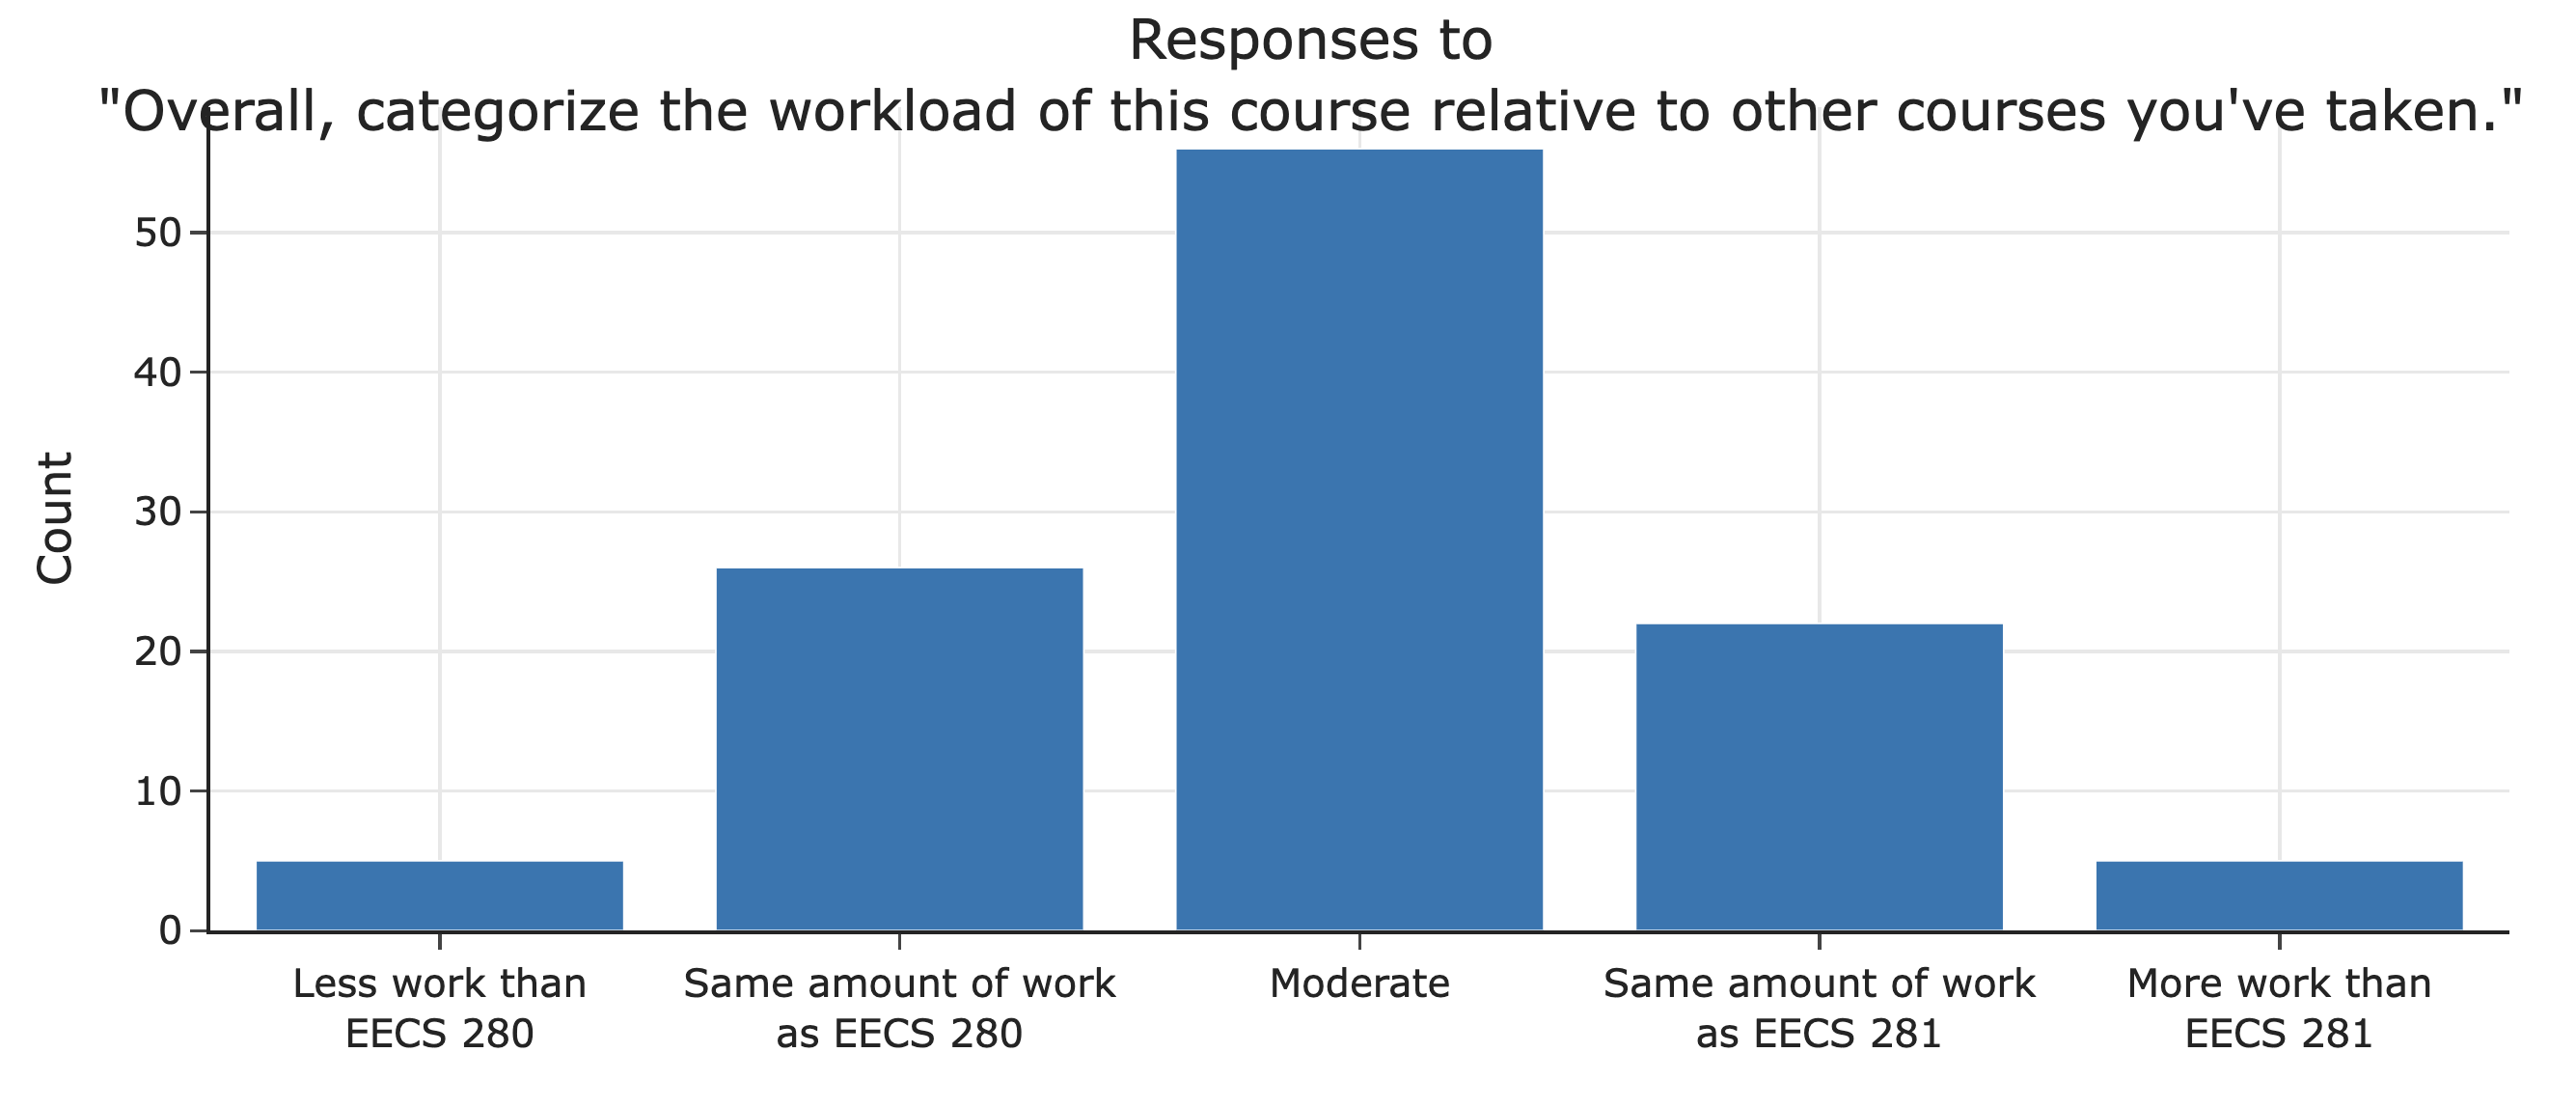
Workload ⚠️
- According to students last semester, the course is a moderate amount of work.
- To succeed, you'll need to learn to solve problems independently.
Documentation and the internet will be your friends.
I'm not going to tell you about every single Python feature in class!
Advice from last year's students
Practice really helps! I think most of the concepts are really easy to understand, but its the details that are hard to remember. As a data scientist, in practice you wouldn't want to look up every little thing, so practice will help in memorizing the "language" of this class and the concepts as well.
Stay consistent (boring, but still important). Buckle in because it covers a wide range of material. The second half is very different from the first half and transitions into a different kind of class.
Plan on starting the HW assignments as early as you can- some took a lot longer than others, and I never really knew how long one would take me until I began. Don't stress too much though, the generous late day policy was incredibly helpful!
My biggest piece of advice is to definitely make sure to keep up with the discussion worksheets every week. I felt like working on those was best way to study for the exam and the reason why I did well on the midterm. In addition, don't rely too much on gpt for the homeworks because it can hurt you in the long run.
Collaboration, Academic Integrity, and Generative AI
- Make sure to read the Syllabus section on Collaboration and Academic Integrity.
- All homeworks are individual. Please discuss ideas and concepts with others, but no sharing code or posting code anywhere – collaboration must not result in solutions that are identifiably similar to other solutions, past or present.
As mentioned before, you can work with a partner on the Final Project.
- We trust that you're here to learn and do the work for yourself.
- We know that tools, like ChatGPT, Claude, Cursor, and Windsurf, can write code for you. Feel free to use such tools wisely.
If you haven't, it's worth experimenting with something like Windsurf!
- You won't be able to use ChatGPT on the exams (or Technical Interview), which are in-person, on paper, and worth 50% of your grade, so make sure you understand how your code actually works.
Data science is the people's science
- We know students have enrolled in this course from a wide variety of backgrounds, and we're committed to helping everyone succeed.
YouTubeVideo('YMnqPTLoj7o')
- If you're ever feeling unsure about your performance in this class or whether data science is "right" for you, email me and we'll chat!
Question 🤔 (Answer at practicaldsc.org/q)
What questions do you have about the syllabus?
The anatomy of Jupyter Notebooks
Let's start by familiarizing ourselves with our programming environment.
You'll need to have followed the Environment Setup steps to follow along.
Jupyter Notebooks 📓
- Often, but not in this class, code is written in a text editor and then run in a command-line interface, or both steps are done in an IDE.
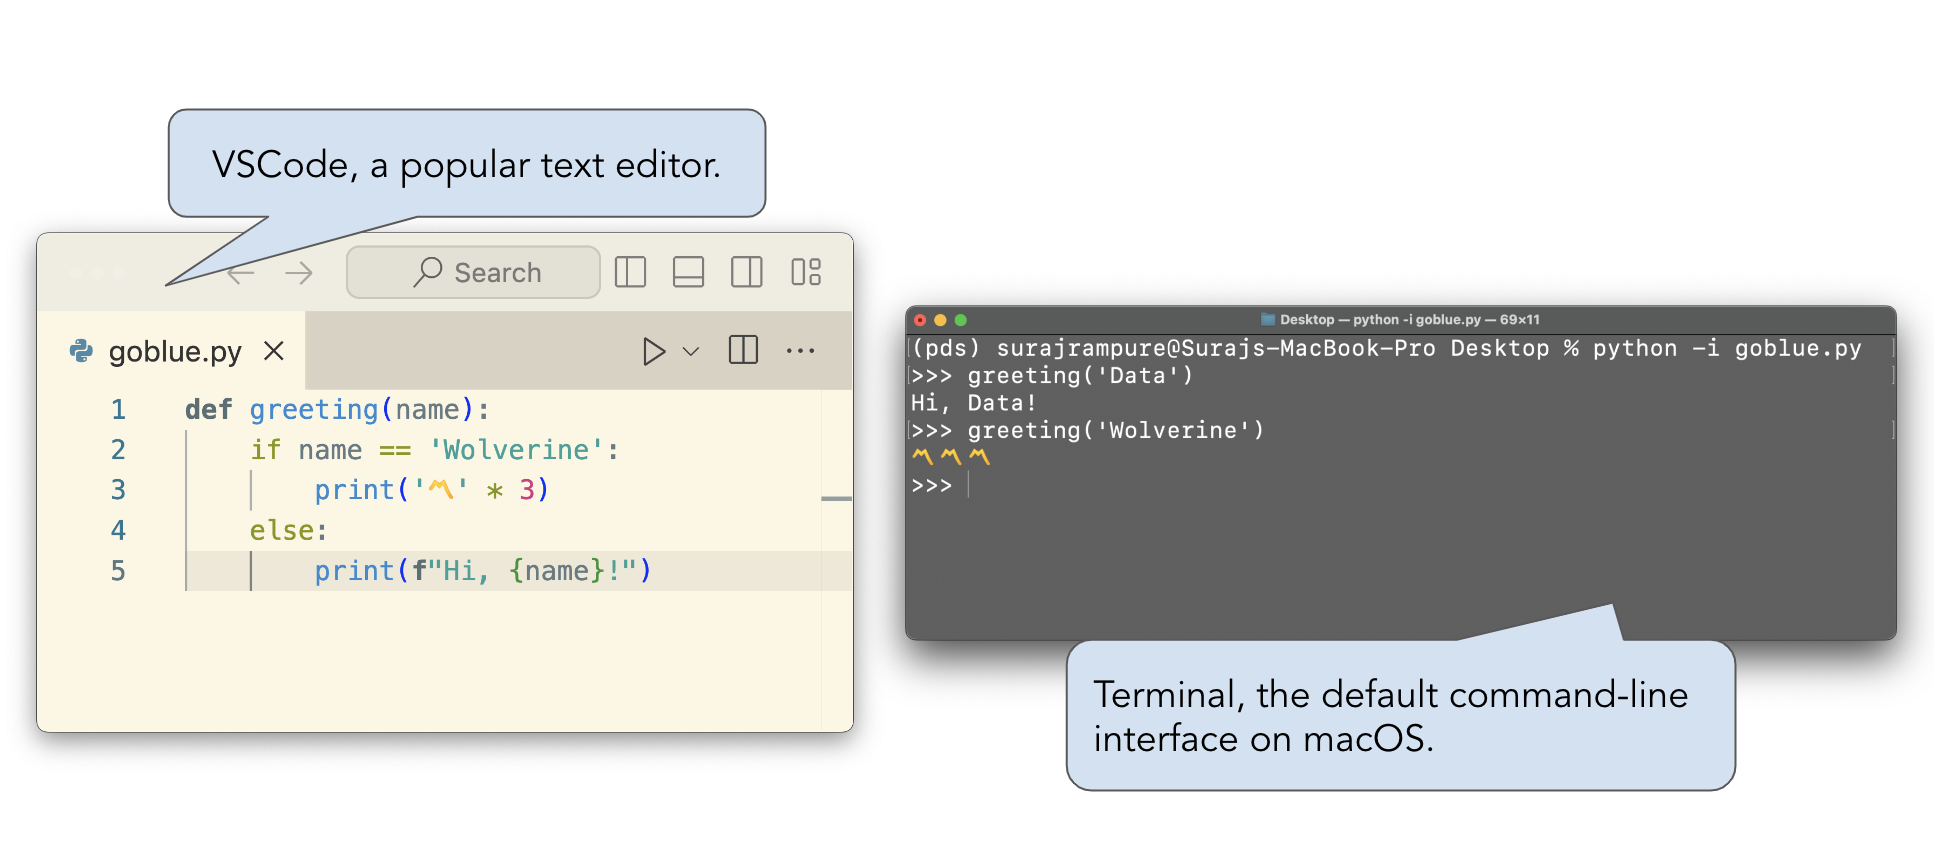
- Jupyter Notebooks allow us to write and run code within a single document. They also allow us to embed text and images and look at visualizations.
Why Jupyter? It stands for Julia, Python, and R, the three original languages they were designed to support.
.ipynbis the extension for Jupyter Notebook files..ipynbfiles can be opened and run in a few related applications, including JupyterLab, Jupyter Notebook, Jupyter Notebook Classic, and VSCode.
The Environment Setup page walks you through how to launch each one.
Note that these lecture slides are a Jupyter Notebook also, we're just using a package to make them look like a presentation.
Cells
- The cell is the basic building block of a Jupyter Notebook. There are two main types of cells.
- Code cells allow you to write and execute code.
When run, code cells display the value of the last evaluated expression.
- Markdown cells allow you to write text and images that aren't Python code.
- Markdown cells are always "run", except when you're editing them.
- Double-click this cell and see what happens!
- Read more about Markdown here.
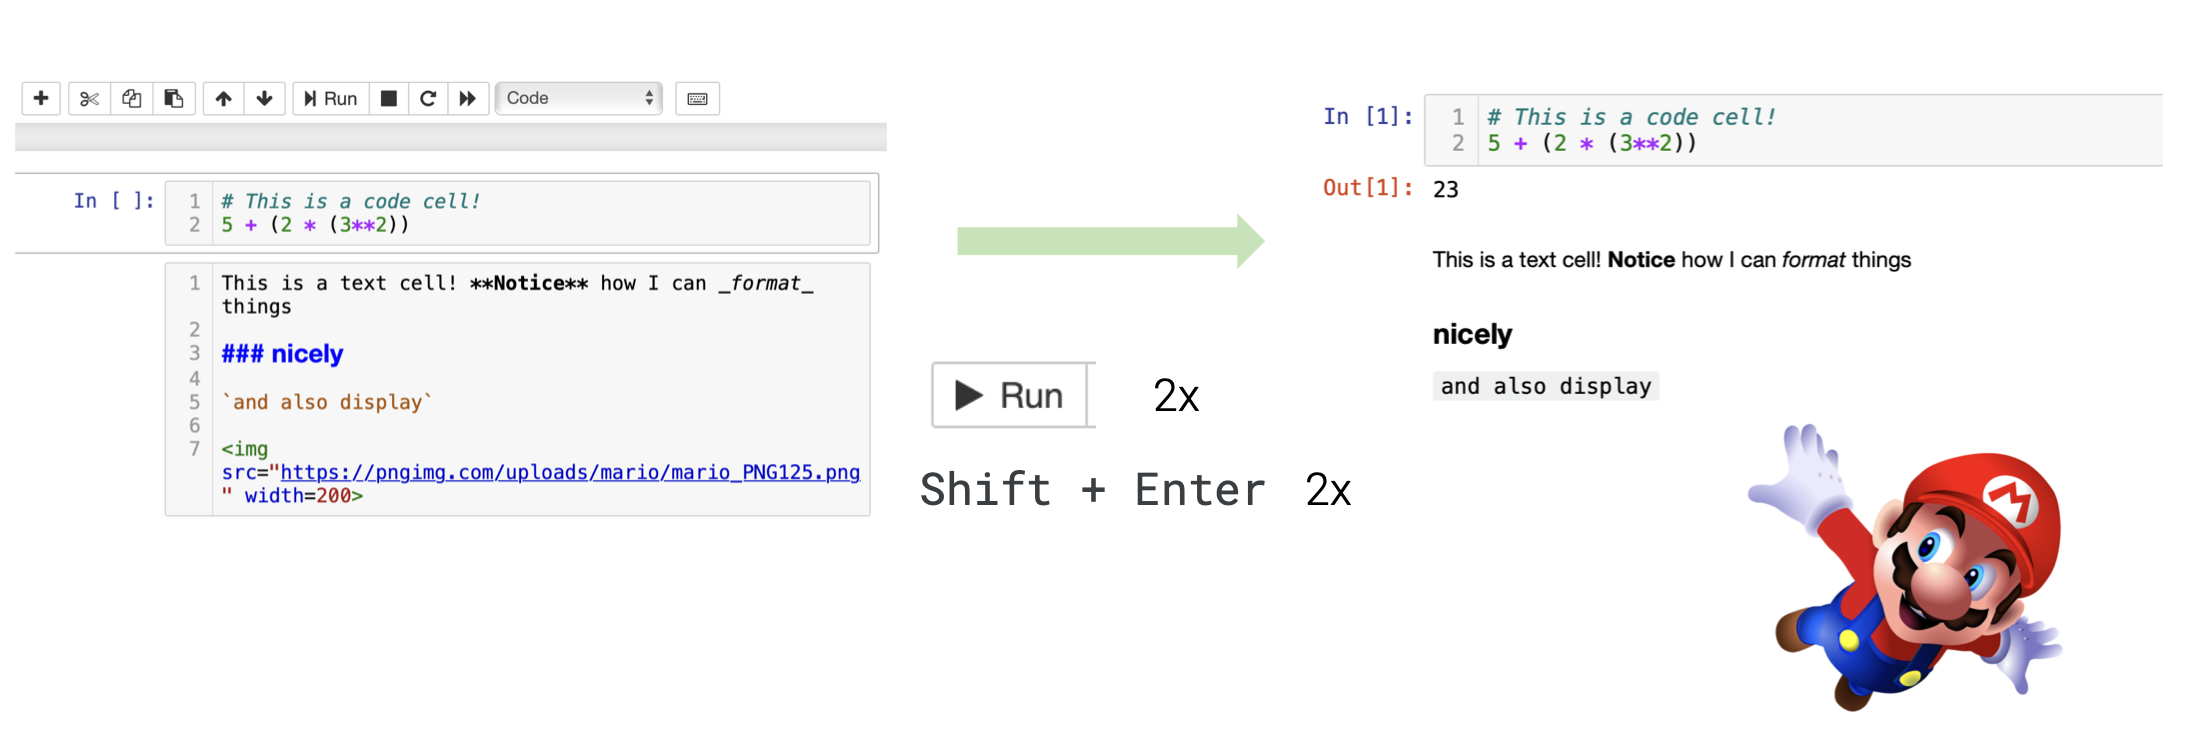 A code cell and Markdown cell, before and after being "run".
Using Python as a calculator
- To familarize ourselves with the notebook environment, let's run a few code cells involving arithmetic expressions.
- To run a code cell, hit
shift+enter(orshift+return) on your keyboard (strongly preferred).
# When you run this cell, the value of the expression appears, but isn't saved anywhere!
# These are comments, by the way.
17 ** 2
289
# Integer division.
25 // 4
6
min(-5.7, 1, 3) + max(4, 9, 7)
3.3
# Why do we only see one line of output?
2 - 4
18 + 15.0
33.0
# Strings can be created using single, double, or triple quotes.
# There's no difference between a string and a char.
'678' + "9" * 3
'678999'
'''November 26,
''' + "1998"
'November 26,\n1998'
# Put ? after the name of a function to see its documentation inline.
# All notebook interfaces support tab for autocompletion, too.
round?
Example: Trends in baby names 👶
To wrap up, we'll show you a cool example of the sort of analysis you'll soon be able to do. Don't worry about any of the details.
Social Security's Top 10 Baby Names of 2023
- The US Social Security Administration releases an article each year listing the most popular baby names.
The 2024 list isn't public yet.
YouTubeVideo('1HUjlpHI5us')
- Let's see if we can verify these facts ourselves using raw data!
The data
- What we're seeing below is a
pandasDataFrame (fancy word for "table"). The DataFrame contains one row for every combination of'Name','Sex', and'Year'.
baby = pd.read_csv('data/baby.csv')
baby
| Name | Sex | Count | Year | |
|---|---|---|---|---|
| 0 | Liam | M | 20456 | 2022 |
| 1 | Noah | M | 18621 | 2022 |
| 2 | Olivia | F | 16573 | 2022 |
| ... | ... | ... | ... | ... |
| 2085155 | Wright | M | 5 | 1880 |
| 2085156 | York | M | 5 | 1880 |
| 2085157 | Zachariah | M | 5 | 1880 |
2085158 rows × 4 columns
- For instance, it's telling us that in 2022, there were 16573 female babies born with the name Olivia.
We don't have information for 2022 or 2023, sadly.
How many babies are in the dataset?
baby['Count'].sum()
365296191
How many babies were recorded in the dataset each year?
baby.groupby('Year')['Count'].sum()
Year
1880     201484
1881     192690
1882     221533
         ...
2020    3333981
2021    3379713
2022    3361896
Name: Count, Length: 143, dtype: int64
baby.groupby('Year')['Count'].sum().plot(title='Number of Babies Born Per Year')
What were the most common names in 2022?
baby[baby['Year'] == 2022].sort_values('Count', ascending=False)
| Name | Sex | Count | Year | |
|---|---|---|---|---|
| 0 | Liam | M | 20456 | 2022 |
| 1 | Noah | M | 18621 | 2022 |
| 2 | Olivia | F | 16573 | 2022 |
| ... | ... | ... | ... | ... |
| 28966 | Mahely | F | 5 | 2022 |
| 28967 | Mahirah | F | 5 | 2022 |
| 31914 | Zymeire | M | 5 | 2022 |
31915 rows × 4 columns
baby[(baby['Year'] == 2022) & (baby['Sex'] == 'F')].sort_values('Count', ascending=False).head(10)
| Name | Sex | Count | Year | |
|---|---|---|---|---|
| 2 | Olivia | F | 16573 | 2022 |
| 4 | Emma | F | 14435 | 2022 |
| 5 | Charlotte | F | 12891 | 2022 |
| ... | ... | ... | ... | ... |
| 14 | Mia | F | 11018 | 2022 |
| 21 | Evelyn | F | 9289 | 2022 |
| 23 | Luna | F | 8922 | 2022 |
10 rows × 4 columns
What about trends in individual names?
baby[baby['Name'] == 'Olivia']
| Name | Sex | Count | Year | |
|---|---|---|---|---|
| 2 | Olivia | F | 16573 | 2022 |
| 13017 | Olivia | M | 16 | 2022 |
| 31917 | Olivia | F | 17798 | 2021 |
| ... | ... | ... | ... | ... |
| 2079563 | Olivia | F | 52 | 1882 |
| 2081652 | Olivia | F | 51 | 1881 |
| 2083640 | Olivia | F | 44 | 1880 |
202 rows × 4 columns
(
    baby[baby['Name'] == 'Olivia']
    .groupby('Year')['Count']
    .sum()
    .plot(title='Number of Babies Born Named "Olivia" Per Year')
)
def name_graph(name):
    fig = (
        baby[baby['Name'] == name]
        .groupby('Year')['Count']
        .sum()
        .plot(title=f'Number of Babies Born Named "{name}" Per Year')
    )
    fig.show()
name_graph('Suraj')
What about your names?
# The first names of everyone in the class!
class_first = np.load('data/sp25-names.npy', allow_pickle=True)
class_first
array(['Abhinav', 'Alvin', 'Andrew', ..., 'Toby', 'Trent', 'Yu'],
      dtype=object)
dropdown_names = widgets.Dropdown(options=class_first, value='Suraj')
def dropdown_names_handler(change):
    if change['name'] == 'value' and (change['new'] != change['old']):
        clear_output()
        display(dropdown_names)
        name_graph(change['new'])
display(dropdown_names)
name_graph('Suraj')
dropdown_names.observe(dropdown_names_handler)