from lec_utils import *
# For illustration purposes only.
def err():
    raise ValueError('😭😭😭 I just deleted all of your files! 😭😭😭')
Announcements 📣
- Homework 4 is due tonight. Watch this video before submitting!
TL;DR: Make surehw04.ipynbis smaller than 1 MB before submitting. - The Midterm Exam is in a few weeks – start working through old exam problems here.
You can even see an example old exam PDF. - Looking for sources of data, or other supplemental resources? Look at our updated Resources page!
Agenda
- Example: Scraping the Happening @ Michigan page.
- APIs and JSON.
- Generalized table manipulation.
- SQL.
- Google Sheets.
Activity
Consider the following HTML document, which represents a webpage containing the top few songs with the most streams on Spotify today in Canada.
<head>
    <title>3*Canada-2022-06-04</title>
</head>
<body>
    <h1>Spotify Top 3 - Canada</h1>
    <table>
        <tr class='heading'>
            <th>Rank</th>
            <th>Artist(s)</th>
            <th>Song</th>
        </tr>
        <tr class=1>
            <td>1</td>
            <td>Harry Styles</td>
            <td>As It Was</td>
        </tr>
        <tr class=2>
            <td>2</td>
            <td>Jack Harlow</td>
            <td>First Class</td>
        </tr>
        <tr class=3>
            <td>3</td>
            <td>Kendrick Lamar</td>
            <td>N95</td>
        </tr>
    </table>
</body>
- Part 1: How many leaf nodes are there in the DOM tree of the previous document — that is, how many nodes have no children?
- Part 2: What does the following line of code evaluate to?
len(soup.find_all("td"))
- Part 3: What does the following line of code evaluate to?
soup.find("tr").get("class")
Example: Scraping the Happening @ Michigan page
Example: Scraping the Happening @ Michigan page
- Our goal is to create a DataFrame with the information about each event at events.umich.edu.
 Today's event page will look different, since I wrote this part of the lecture a few days ago!
import requests
from bs4 import BeautifulSoup
res = requests.get('https://events.umich.edu')
res
<Response [200]>
soup = BeautifulSoup(res.text)
- Let's start by opening the page in Chrome, right clicking on the page, and clicking "Inspect".
As we can see, the HTML is much more complicated this time – this is usually the case for real websites!
Identifying <div>s
- It's not easy identifying which
<div>s we want. The Inspect tool makes this easier, but it's good to verify thatfind_allis finding the right number of elements.
divs = soup.find_all(class_='col-xs-12')
len(divs)
107
- Again, let's deal with one
<div>at a time. First, we should extract the title of the event.
divs[0]
<div class="col-xs-12 col-sm-4 col-md-4 col-lg-2 flex no-pad">
<div class="event-listing-grid event-single">
<time class="time-banner" datetime="2024-09-26 8:00"><i class="fa fa-clock-o"></i> Sep 26, 2024 8:00am</time>
<div class="list-image">
<a alt="MiCAN Summit" href="/event/123300" style="background:url(https://events.umich.edu/media/cache/event_list_2x/media/attachments/2024/07/event_123300_original-1.jpeg) center center no-repeat; background-size:cover; position:absolute; width:100%;height:100%; top:0px;left:0px;" title="MiCAN Summit">
</a>
</div>
<div class="event-info">
<div class="event-title"><h3>
<a href="/event/123300" title="2024 Michigan Climate Summit">
2024 Michigan Climate Summit
</a></h3>
<h4>2024 MiCAN Summit</h4>
</div>
<ul class="event-details">
<li class="item">
<a href="/list?filter=locations:71" title="Rackham Graduate School (Horace H.)"><i class="fa fa-location-arrow fa-fw"></i><span> Rackham Graduate School...</span></a>
</li>
<li class="item"><a href="/group/3454" title="School for Environment and Sustainability"><i class="fa fa-group fa-fw"></i><span>
School for Environment and...
</span></a></li>
<li class="item"><a href="/list?filter=alltypes:5"><i class="fa fa-list fa-fw"></i><span> Conference / Symposium </span></a></li>
<li class="item"><a href="https://www.miclimateaction.org/2024_michigan_climate_summit">
<i class="fa fa-link fa-fw"></i>
<span>RSVP</span>
</a></li>
</ul>
<!--
<p>
This year's Summit is all about Climate Civics! Together, attendees will explore the intersections between civic engagement, social justice,...
(
2024-09-26 8:00am
)
</p>
-->
</div>
</div>
</div>
divs[0].find('div', class_='event-title').find('a').get('title')
'2024 Michigan Climate Summit'
- The time and location, too.
divs[0].find('time').get('datetime')
'2024-09-26 8:00'
divs[0].find('ul').find('a').get('title')
'Rackham Graduate School (Horace H.)'
Parsing a single event, and then every event
- As before, we'll implement a function that takes in a BeautifulSoup object corresponding to a single
<div>and returns a dictionary with the relevant information about that event.
def process_event(div):
    title = div.find('div', class_='event-title').find('a').get('title')
    location = div.find('ul').find('a').get('title')
    time = pd.to_datetime(div.find('time').get('datetime')) # Good idea!
    return {'title': title, 'time': time, 'location': location}
process_event(divs[12])
{'title': "An expert's guide to breaking into Architecture, Engineering & Construction",
 'time': Timestamp('2024-09-26 12:00:00'),
 'location': ''}
- Now, we can call it on every
<div>indivs.
Remember, we already randivs = soup.find_all(class_='col-xs-12').
row_list = []
for div in divs:
    try:
        row_list.append(process_event(div))
    except Exception as e:
        print(e)
'NoneType' object has no attribute 'find'
events = pd.DataFrame(row_list)
events.head()
| title | time | location | |
|---|---|---|---|
| 0 | 2024 Michigan Climate Summit | 2024-09-26 08:00:00 | Rackham Graduate School (Horace H.) |
| 1 | LSA Transfer Information Session | 2024-09-26 09:00:00 | Virtual |
| 2 | Earthfest 2024 | 2024-09-26 10:00:00 | Diag - Central Campus |
| 3 | FAA Aviation Safety STEM Career Symposium-Expl... | 2024-09-26 10:00:00 | |
| 4 | Internship Lab | 2024-09-26 11:00:00 |
- Now,
eventsis a DataFrame, like any other!
# Which events are in-person today?
events[~events['location'].isin(['Virtual', ''])]
| title | time | location | |
|---|---|---|---|
| 0 | 2024 Michigan Climate Summit | 2024-09-26 08:00:00 | Rackham Graduate School (Horace H.) |
| 2 | Earthfest 2024 | 2024-09-26 10:00:00 | Diag - Central Campus |
| 6 | Mini Museum: The Sum of Small Parts Student Ex... | 2024-09-26 11:00:00 | Stamps Gallery, 201 South Division Street Ann ... |
| ... | ... | ... | ... |
| 103 | Markley Hall (2024-2025) (Housing) | 2024-09-26 20:00:00 | South Lounge |
| 104 | NPHC Council Meetings - Fall 2024 | 2024-09-26 20:00:00 | 1443 Washtenaw Ave |
| 105 | Women's Soccer vs Rutgers | 2024-09-26 20:00:00 | U-M Soccer Stadium |
56 rows × 3 columns
Web data in practice
- The spread of true and false news online by Vosoughi et al. compared how true and false news spreads via X (Twitter):
There is worldwide concern over false news and the possibility that it can influence political, economic, and social well-being. To understand how false news spreads, Vosoughi et al. used a data set of rumor cascades on Twitter from 2006 to 2017. About 126,000 rumors were spread by ∼3 million people. False news reached more people than the truth; the top 1% of false news cascades diffused to between 1000 and 100,000 people, whereas the truth rarely diffused to more than 1000 people. Falsehood also diffused faster than the truth. The degree of novelty and the emotional reactions of recipients may be responsible for the differences observed.
- To conduct this study, the authors used the X API for accessing tweets and web-scraped fact-checking websites to verify whether news was false or not.
APIs and JSON
Recap: Scraping vs. APIs
- There are two ways to programmatically access data on the internet: either by scraping, or through an API.
- Scraping is the act of emulating a web browser to access its HTML source code.
When scraping, you get back data as HTML and have to parse that HTML to extract the information you want. Parse means to "extract meaning from a sequence of symbols".
- An application programming interface, or API, is a service that makes data directly available to the user in a convenient fashion. Usually, APIs give us code back as JSON objects.
APIs are made by organizations that host data. For example, X (formally known as Twitter) has an API, as does OpenAI, the creators of ChatGPT.
- To understand how to use an API, we must learn how to work with JSON objects.
JSON
- JSON stands for JavaScript Object Notation. It is a lightweight format for storing and transferring data.
- It is:
- very easy for computers to read and write.
- moderately easy for programmers to read and write by hand.
- meant to be generated and parsed.
- Most modern languages have an interface for working with JSON objects.
JSON objects resemble Python dictionaries (but are not the same!).
JSON data types
| Type | Description |
|---|---|
| String | Anything inside double quotes. |
| Number | Any number (no difference between ints and floats). |
| Boolean | true and false. |
| Null | JSON's empty value, denoted by null. |
| Array | Like Python lists. |
| Object | A collection of key-value pairs, like dictionaries. Keys must be strings, values can be anything (even other objects). |
See json-schema.org for more details.
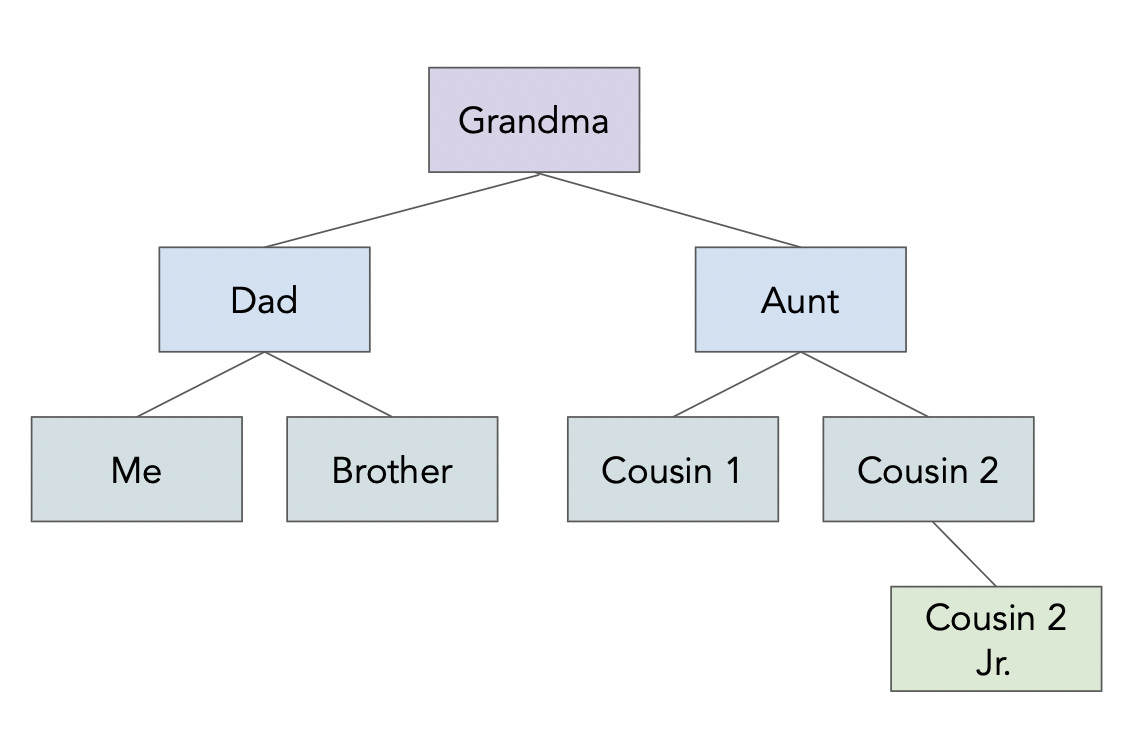
!cat data/family.json
{
    "name": "Grandma",
    "age": 94,
    "children": [
        {
        "name": "Dad",
        "age": 60,
        "children": [{"name": "Me", "age": 24},
                     {"name": "Brother", "age": 22}]
        },
        {
        "name": "My Aunt",
        "children": [{"name": "Cousin 1", "age": 34},
                     {"name": "Cousin 2", "age": 36, "children":
                        [{"name": "Cousin 2 Jr.", "age": 2}]
                     }
                    ]
        }
    ]
}
import json
with open('data/family.json', 'r') as f:
    family_str = f.read()
    family_tree = json.loads(family_str)
family_tree
{'name': 'Grandma',
 'age': 94,
 'children': [{'name': 'Dad',
   'age': 60,
   'children': [{'name': 'Me', 'age': 24}, {'name': 'Brother', 'age': 22}]},
  {'name': 'My Aunt',
   'children': [{'name': 'Cousin 1', 'age': 34},
    {'name': 'Cousin 2',
     'age': 36,
     'children': [{'name': 'Cousin 2 Jr.', 'age': 2}]}]}]}
family_tree['children'][1]['children'][0]['age']
34
eval, which stands for "evaluate", is a function built into Python.
- It takes in a string containing a Python expression and evaluates it in the current context.
x = 4
eval('x + 5')
9
- It seems like
evalcan do the same thing thatjson.loadsdoes...
eval(family_str)
{'name': 'Grandma',
 'age': 94,
 'children': [{'name': 'Dad',
   'age': 60,
   'children': [{'name': 'Me', 'age': 24}, {'name': 'Brother', 'age': 22}]},
  {'name': 'My Aunt',
   'children': [{'name': 'Cousin 1', 'age': 34},
    {'name': 'Cousin 2',
     'age': 36,
     'children': [{'name': 'Cousin 2 Jr.', 'age': 2}]}]}]}
- But you should almost never use
eval.
with open('data/evil_family.json', 'r') as f:
    evil_family_str = f.read()
eval(evil_family_str)
---------------------------------------------------------------------------
ValueError                                Traceback (most recent call last)
Cell In[22], line 3
      1 with open('data/evil_family.json', 'r') as f:
      2     evil_family_str = f.read()
----> 3 eval(evil_family_str)

File <string>:6

Cell In[1], line 4, in err()
      3 def err():
----> 4     raise ValueError('😭😭😭 I just deleted all of your files! 😭😭😭')

ValueError: 😭😭😭 I just deleted all of your files! 😭😭😭
- Oh no! Since
evil_family.json, which could have been downloaded from the internet, contained malicious code, we now lost all of our files.
- This happened because
evalevaluates all parts of the input string as if it were Python code.
- You never need to do this – instead, use the
.json()method of a response object, or use thejsonlibrary.
json.load(f)loads a JSON file from a file object.
json.loads(f)loads a JSON file from a string.
json.loads(evil_family_str)
---------------------------------------------------------------------------
JSONDecodeError                           Traceback (most recent call last)
Cell In[23], line 1
----> 1 json.loads(evil_family_str)

File ~/miniforge3/envs/pds/lib/python3.10/json/__init__.py:346, in loads(s, cls, object_hook, parse_float, parse_int, parse_constant, object_pairs_hook, **kw)
    341     s = s.decode(detect_encoding(s), 'surrogatepass')
    343 if (cls is None and object_hook is None and
    344         parse_int is None and parse_float is None and
    345         parse_constant is None and object_pairs_hook is None and not kw):
--> 346     return _default_decoder.decode(s)
    347 if cls is None:
    348     cls = JSONDecoder

File ~/miniforge3/envs/pds/lib/python3.10/json/decoder.py:337, in JSONDecoder.decode(self, s, _w)
    332 def decode(self, s, _w=WHITESPACE.match):
    333     """Return the Python representation of ``s`` (a ``str`` instance
    334     containing a JSON document).
    335
    336     """
--> 337     obj, end = self.raw_decode(s, idx=_w(s, 0).end())
    338     end = _w(s, end).end()
    339     if end != len(s):

File ~/miniforge3/envs/pds/lib/python3.10/json/decoder.py:355, in JSONDecoder.raw_decode(self, s, idx)
    353     obj, end = self.scan_once(s, idx)
    354 except StopIteration as err:
--> 355     raise JSONDecodeError("Expecting value", s, err.value) from None
    356 return obj, end

JSONDecodeError: Expecting value: line 6 column 17 (char 84)
- Since
util.err()is not a string in JSON (there are no quotes around it),json.loadsis not able to parse it as a JSON object.
- This "safety check" is intentional.
- Never trust data from an unfamiliar site.
- Never use
evalon "raw" data that you didn't create!
- The JSON data format needs to be parsed, not evaluated as a dictionary. It was designed with safety in mind!
Aside: pd.read_json
pandasalso has a built-inread_jsonfunction.
with open('data/family.json', 'r') as f:
    family_df = pd.read_json(f)
family_df
| name | age | children | |
|---|---|---|---|
| 0 | Grandma | 94 | {'name': 'Dad', 'age': 60, 'children': [{'name... |
| 1 | Grandma | 94 | {'name': 'My Aunt', 'children': [{'name': 'Cou... |
- It only makes sense to use it, though, when you have a JSON file that has some sort of tabular structure. Our family tree example does not.
API terminology
- A URL, or uniform resource locator, describes the location of a website or resource.
- API requests are just
GET/POSTrequests to a specially maintained URL.
- As an example, we'll look at the Pokémon API.
- All requests are made to:
https://pokeapi.co/api/v2/{endpoint}/{name}
For example, to learn about Pikachu, we use the
pokemonendpoint with namepikachu.https://pokeapi.co/api/v2/pokemon/pikachu
Or, to learn about all water Pokemon, we use the
typeendpoint with namewater.https://pokeapi.co/api/v2/pokemon/pikachu
API requests
- To illustrate, let's make a
GETrequest to learn more about Pikachu.
def request_pokemon(name):
    url = f'https://pokeapi.co/api/v2/pokemon/{name}'
    return requests.get(url)
res = request_pokemon('pikachu')
res
<Response [200]>
- Remember, the 200 status code is good! Let's take a look at the content:
res.content[:1000]
b'{"abilities":[{"ability":{"name":"static","url":"https://pokeapi.co/api/v2/ability/9/"},"is_hidden":false,"slot":1},{"ability":{"name":"lightning-rod","url":"https://pokeapi.co/api/v2/ability/31/"},"is_hidden":true,"slot":3}],"base_experience":112,"cries":{"latest":"https://raw.githubusercontent.com/PokeAPI/cries/main/cries/pokemon/latest/25.ogg","legacy":"https://raw.githubusercontent.com/PokeAPI/cries/main/cries/pokemon/legacy/25.ogg"},"forms":[{"name":"pikachu","url":"https://pokeapi.co/api/v2/pokemon-form/25/"}],"game_indices":[{"game_index":84,"version":{"name":"red","url":"https://pokeapi.co/api/v2/version/1/"}},{"game_index":84,"version":{"name":"blue","url":"https://pokeapi.co/api/v2/version/2/"}},{"game_index":84,"version":{"name":"yellow","url":"https://pokeapi.co/api/v2/version/3/"}},{"game_index":25,"version":{"name":"gold","url":"https://pokeapi.co/api/v2/version/4/"}},{"game_index":25,"version":{"name":"silver","url":"https://pokeapi.co/api/v2/version/5/"}},{"game_index":'
Working with JSON objects
- The response we got back looks like JSON. We can extract the JSON from this request with the
jsonmethod (or by passingres.texttojson.loads).
pikachu = res.json()
pikachu
pikachu.keys()
dict_keys(['abilities', 'base_experience', 'cries', 'forms', 'game_indices', 'height', 'held_items', 'id', 'is_default', 'location_area_encounters', 'moves', 'name', 'order', 'past_abilities', 'past_types', 'species', 'sprites', 'stats', 'types', 'weight'])
pikachu['weight']
60
pikachu['abilities'][1]['ability']['name']
'lightning-rod'
Invalid GET requests
- Let's try a
GETrequest for'wolverine'.
request_pokemon('wolverine')
<Response [404]>
- We receive a 404 error, since there is no Pokemon named
'wolverine'!
More on APIs
- We accessed the Pokémon API by making requests. But, some APIs exist as Python wrappers, which allow you to make requests by calling Python functions.
request_pokemonis essentially a wrapper for (a small part of) the Pokémon API.
- Some APIs will require you to create an API key, and send that key as part of your request.
See Homework 5 for an example!
- Many of the APIs you'll use are "REST" APIs. Learn more about RESTful APIs here.
REST stands for "Representational State Transfer." One of the key properties of a RESTful API is that servers don't store any information about previous requests, or who is making them.
Generalized table manipulation
Representations of tabular data
- In this class, we've worked with DataFrames in
pandas.
- When we say
pandasDataFrame, we're talking about thepandasAPI for its DataFrame objects.
- When we say "DataFrame", we're referring to a general way to represent data.
DataFrames organize data into rows and columns, with labels for both rows and columns.
- There many other ways to work with data tables, each of which have their pros and cons.
Some examples include R data frames, SQL databases, spreadsheets in Google Sheets/Excel, or even matrices from linear algebra.
Alternatives
- Below, we discuss pros and cons of (some of) the ways we can work with tabular data.
| Platform | Pros ✅ | Cons ❌ |
|---|---|---|
pandas DataFrames |
Works well with the Python ecosystem (for visualization, machien learning, domain-specifc purposes, etc.), extremely flexible, reproducible steps | Steep learning curve (need to know Python too) and messy code, easy to make destructive in-place modifications, no persistence (everything starts from a CSV file) |
| R data frames | Designed specifically for data science so statistics and visualizations are easy; reproducible steps | R isn't as general-purpose as Python, no persistence |
| SQL | Scalable, good for maintaining many large, important datasets with many concurrent users | Requires lots of infrastructure, advanced operations can be challenging |
| Spreadsheets | Widespread use, very easy to get started, easy for sharing | Steps aren't reproducible, advanced operations can be challenging |
- A common workflow is to load a subset of data in from a database system into
pandas, then do further cleaning and visualization.
- Another is to load and clean data in
pandas, then store it in a database system for others to use.
Relational algebra
- Relational algebra captures common data operations between many data table systems.
We won't test you on relational algebra syntax, but if you'd like to learn more, take EECS 484: Database Management Systems.
For example, the following expression describes a calculation in relational algebra:
$$\pi_{\text{int_rate}}(\sigma_{\text{state} = \text{"MI"}}(\text{loans}))$$
$\pi$ stands for "project," i.e. selecting columns $\sigma$ stands for "select," i.e. selecting rows.
- In
pandas, we'd implement this expression as follows:
loans.loc[loans['state'] == 'MI', 'int_rate']
- How would we implement it in SQL? Or a spreadsheet?
Comparing pandas, SQL, and Google Sheets
- To show you how the tabular manipulation skills you've learned in
pandasgeneralize to other systems, we will answer a few questions in all three of the above platforms.
- First, we'll work through our analysis in
pandas, and then in SQL, and finally, in a Google Sheets document.
Overview: Top 200 streams
- Our dataset contains the number of streams for the top 200 songs on Spotify, for the week leading up to September 19th.
We downloaded it from here. This is the most recent week it let us download.
- Let's load it in as a
pandasDataFrame.
charts = pd.read_csv('data/regional-global-weekly-2024-09-19.csv')
charts
| rank | uri | artist_names | track_name | ... | peak_rank | previous_rank | weeks_on_chart | streams | |
|---|---|---|---|---|---|---|---|---|---|
| 0 | 1 | spotify:track:2plbrEY59IikOBgBGLjaoe | Lady Gaga, Bruno Mars | Die With A Smile | ... | 1 | 1 | 5 | 76502673 |
| 1 | 2 | spotify:track:6dOtVTDdiauQNBQEDOtlAB | Billie Eilish | BIRDS OF A FEATHER | ... | 1 | 2 | 18 | 54756808 |
| 2 | 3 | spotify:track:5G2f63n7IPVPPjfNIGih7Q | Sabrina Carpenter | Taste | ... | 3 | 3 | 4 | 48790619 |
| ... | ... | ... | ... | ... | ... | ... | ... | ... | ... |
| 197 | 198 | spotify:track:3EaJDYHA0KnX88JvDhL9oa | Steve Lacy | Dark Red | ... | 66 | 200 | 118 | 8901006 |
| 198 | 199 | spotify:track:0gEyKnHvgkrkBM6fbeHdwK | The Cranberries | Linger | ... | 199 | -1 | 2 | 8867800 |
| 199 | 200 | spotify:track:7iUtQNMRB8ZkKC4AmEuCJC | Myke Towers | LA FALDA | ... | 24 | 185 | 36 | 8848312 |
200 rows × 9 columns
charts.columns
Index(['rank', 'uri', 'artist_names', 'track_name', 'source', 'peak_rank',
       'previous_rank', 'weeks_on_chart', 'streams'],
      dtype='object')
- As an aside, we can play Spotify songs directly in our notebooks!
def show_spotify(uri):
    code = uri[uri.rfind(':')+1:]
    src = f"https://open.spotify.com/embed/track/{code}"
    width = 400
    height = 75
    display(IFrame(src, width, height))
my_uri = charts.loc[charts['track_name'] == 'Yellow', 'uri'].iloc[0]
my_uri
'spotify:track:3AJwUDP919kvQ9QcozQPxg'
show_spotify(my_uri)
Complete using pandas.
Task 1: Find the total number of streams of songs by Sabrina Carpenter.
task_1 = charts.loc[charts['artist_names'] == 'Sabrina Carpenter', 'streams'].sum()
task_1
212960137
Complete using pandas.
Task 2: Find the total number of streams per artist, sorted by number of streams in descending order. Only show the top 5 artists.
task_2 = (
    charts
    .groupby('artist_names')
    ['streams']
    .sum()
    .sort_values(ascending=False)
    .head(5)
)
task_2
artist_names
Sabrina Carpenter        212960137
Billie Eilish            107797821
Chappell Roan             92990557
Linkin Park               89935206
Lady Gaga, Bruno Mars     76502673
Name: streams, dtype: int64
Complete using pandas.
Task 3: Find the artist with the lowest average number of streams, among artists with at least 5 songs in the Top 200.
task_3 = (
    charts
    .groupby('artist_names')
    .filter(lambda df: df.shape[0] >= 5)
    .groupby('artist_names')
    ['streams']
    .mean()
    .sort_values()
    .head(1)
)
task_3
artist_names
Bruno Mars    1.24e+07
Name: streams, dtype: float64
Complete using pandas.
Task 4: Find the number of songs with a higher ranking this week than last week.
task_4 = charts[charts['rank'] > charts['previous_rank']].shape[0]
task_4
119
Complete using pandas.
Task 5: charts_old contains the Top 200 songs in the previous week.
Find the song with the largest increase in streams between last week and this week, among songs that were in the Top 200 in both weeks.
charts_old = pd.read_csv('data/regional-global-weekly-2024-09-12.csv')
charts_old.head()
| rank | uri | artist_names | track_name | ... | peak_rank | previous_rank | weeks_on_chart | streams | |
|---|---|---|---|---|---|---|---|---|---|
| 0 | 1 | spotify:track:2plbrEY59IikOBgBGLjaoe | Lady Gaga, Bruno Mars | Die With A Smile | ... | 1 | 1 | 4 | 74988392 |
| 1 | 2 | spotify:track:6dOtVTDdiauQNBQEDOtlAB | Billie Eilish | BIRDS OF A FEATHER | ... | 1 | 2 | 17 | 56949755 |
| 2 | 3 | spotify:track:5G2f63n7IPVPPjfNIGih7Q | Sabrina Carpenter | Taste | ... | 3 | 3 | 3 | 49847514 |
| 3 | 4 | spotify:track:7tI8dRuH2Yc6RuoTjxo4dU | Jimin | Who | ... | 1 | 4 | 8 | 45431448 |
| 4 | 5 | spotify:track:2qSkIjg1o9h3YT9RAgYN75 | Sabrina Carpenter | Espresso | ... | 1 | 5 | 22 | 44982843 |
5 rows × 9 columns
with_old = (
    charts[['uri', 'track_name', 'artist_names', 'streams']]
    .merge(charts_old[['uri', 'streams',]], on='uri', suffixes=('_new', '_old'))
)
task_5 = (
    with_old
    .assign(change=with_old['streams_new'] - with_old['streams_old'])
    .sort_values('change', ascending=False)
    [['track_name', 'artist_names', 'change']]
    .head(1)
)
task_5
| track_name | artist_names | change | |
|---|---|---|---|
| 5 | Good Luck, Babe! | Chappell Roan | 3217539 |
Complete using pandas.
Task 6: Find the 4 songs with the most artists.
task_6 = (
    charts
    .assign(num_artists=charts['artist_names'].str.count(', '))
    .sort_values('num_artists', ascending=False)
    .head(4)
)
task_6
| rank | uri | artist_names | track_name | ... | previous_rank | weeks_on_chart | streams | num_artists | |
|---|---|---|---|---|---|---|---|---|---|
| 45 | 46 | spotify:track:1BJJbSX6muJVF2AK7uH1x4 | Adam Port, Stryv, Keinemusik, Orso, Malachiii | Move | ... | 31 | 14 | 15987047 | 4 |
| 186 | 187 | spotify:track:22skzmqfdWrjJylampe0kt | Macklemore & Ryan Lewis, Macklemore, Ryan Lewi... | Can't Hold Us (feat. Ray Dalton) | ... | 163 | 132 | 9050984 | 3 |
| 194 | 195 | spotify:track:28drn6tQo95MRvO0jQEo5C | Future, Metro Boomin, Travis Scott, Playboi Carti | Type Shit | ... | -1 | 25 | 8942475 | 3 |
| 177 | 178 | spotify:track:4QNpBfC0zvjKqPJcyqBy9W | Pitbull, AFROJACK, Ne-Yo, Nayer | Give Me Everything (feat. Nayer) | ... | 165 | 19 | 9265696 | 3 |
4 rows × 10 columns
SQL
Overview: SQL
- SQL stands for "Structured Query Language". It is the standard language for database manipulation.
Each database system – for instance, MySQL, SQLite, DuckDB, or PostgreSQL – has its own slightly different version of SQL with special features to that system.
- SQL is a declarative language.
In SQL, you just describe what you want calculated, not how you want it calculated. It's the database engine's job to figure out how to process your query.
SELECT artist_names, SUM(streams) AS total_streams FROM charts
        GROUP BY artist_names
        ORDER BY total_streams DESC
        LIMIT 5;
- We'll work with two SQL database platforms: SQLite and DuckDB.
SQLite comes pre-installed on most systems. DuckDB is open-source, and integrates withpandasreally well.
Example SQL syntax
- All code we write in SQL is referred to as a "query", and all SQL queries follow the same general template:
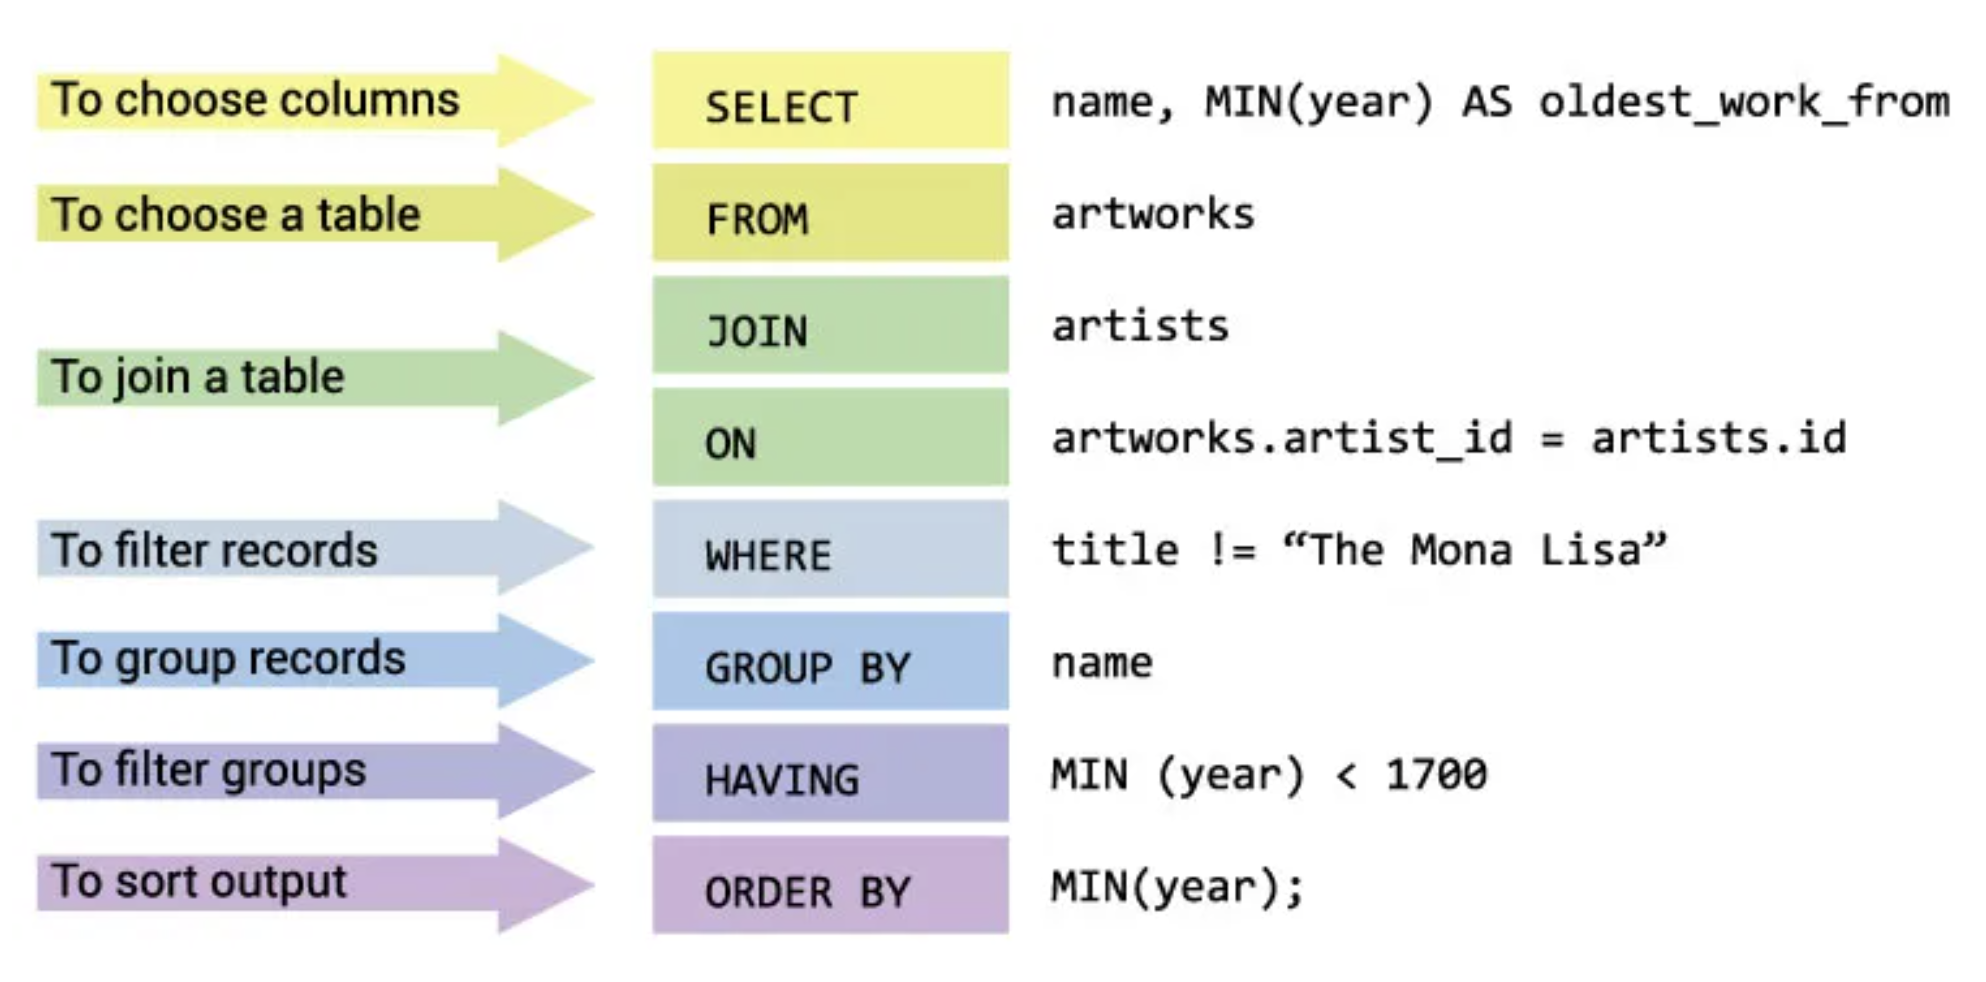
(source)
- W3Schools has examples of SQL syntax, as does the example above.
Connecting to a database using sqlite3
sqlite3comes pre-installed on most operating systems.
- We'll answer our first few tasks by working with
sqlite3in the command-line.
- To follow along:
- Open your Terminal.
cdto thelec10/datafolder.- Run
sqlite3 spotify.db.
- These steps will open a
sqlite3interpreter, connected to thespotify.dbdatabase.
A database file can contain multiple tables. This one contains two:chartsandcharts_old.
Complete using SQL.
Task 1: Find the total number of streams of songs by Sabrina Carpenter.
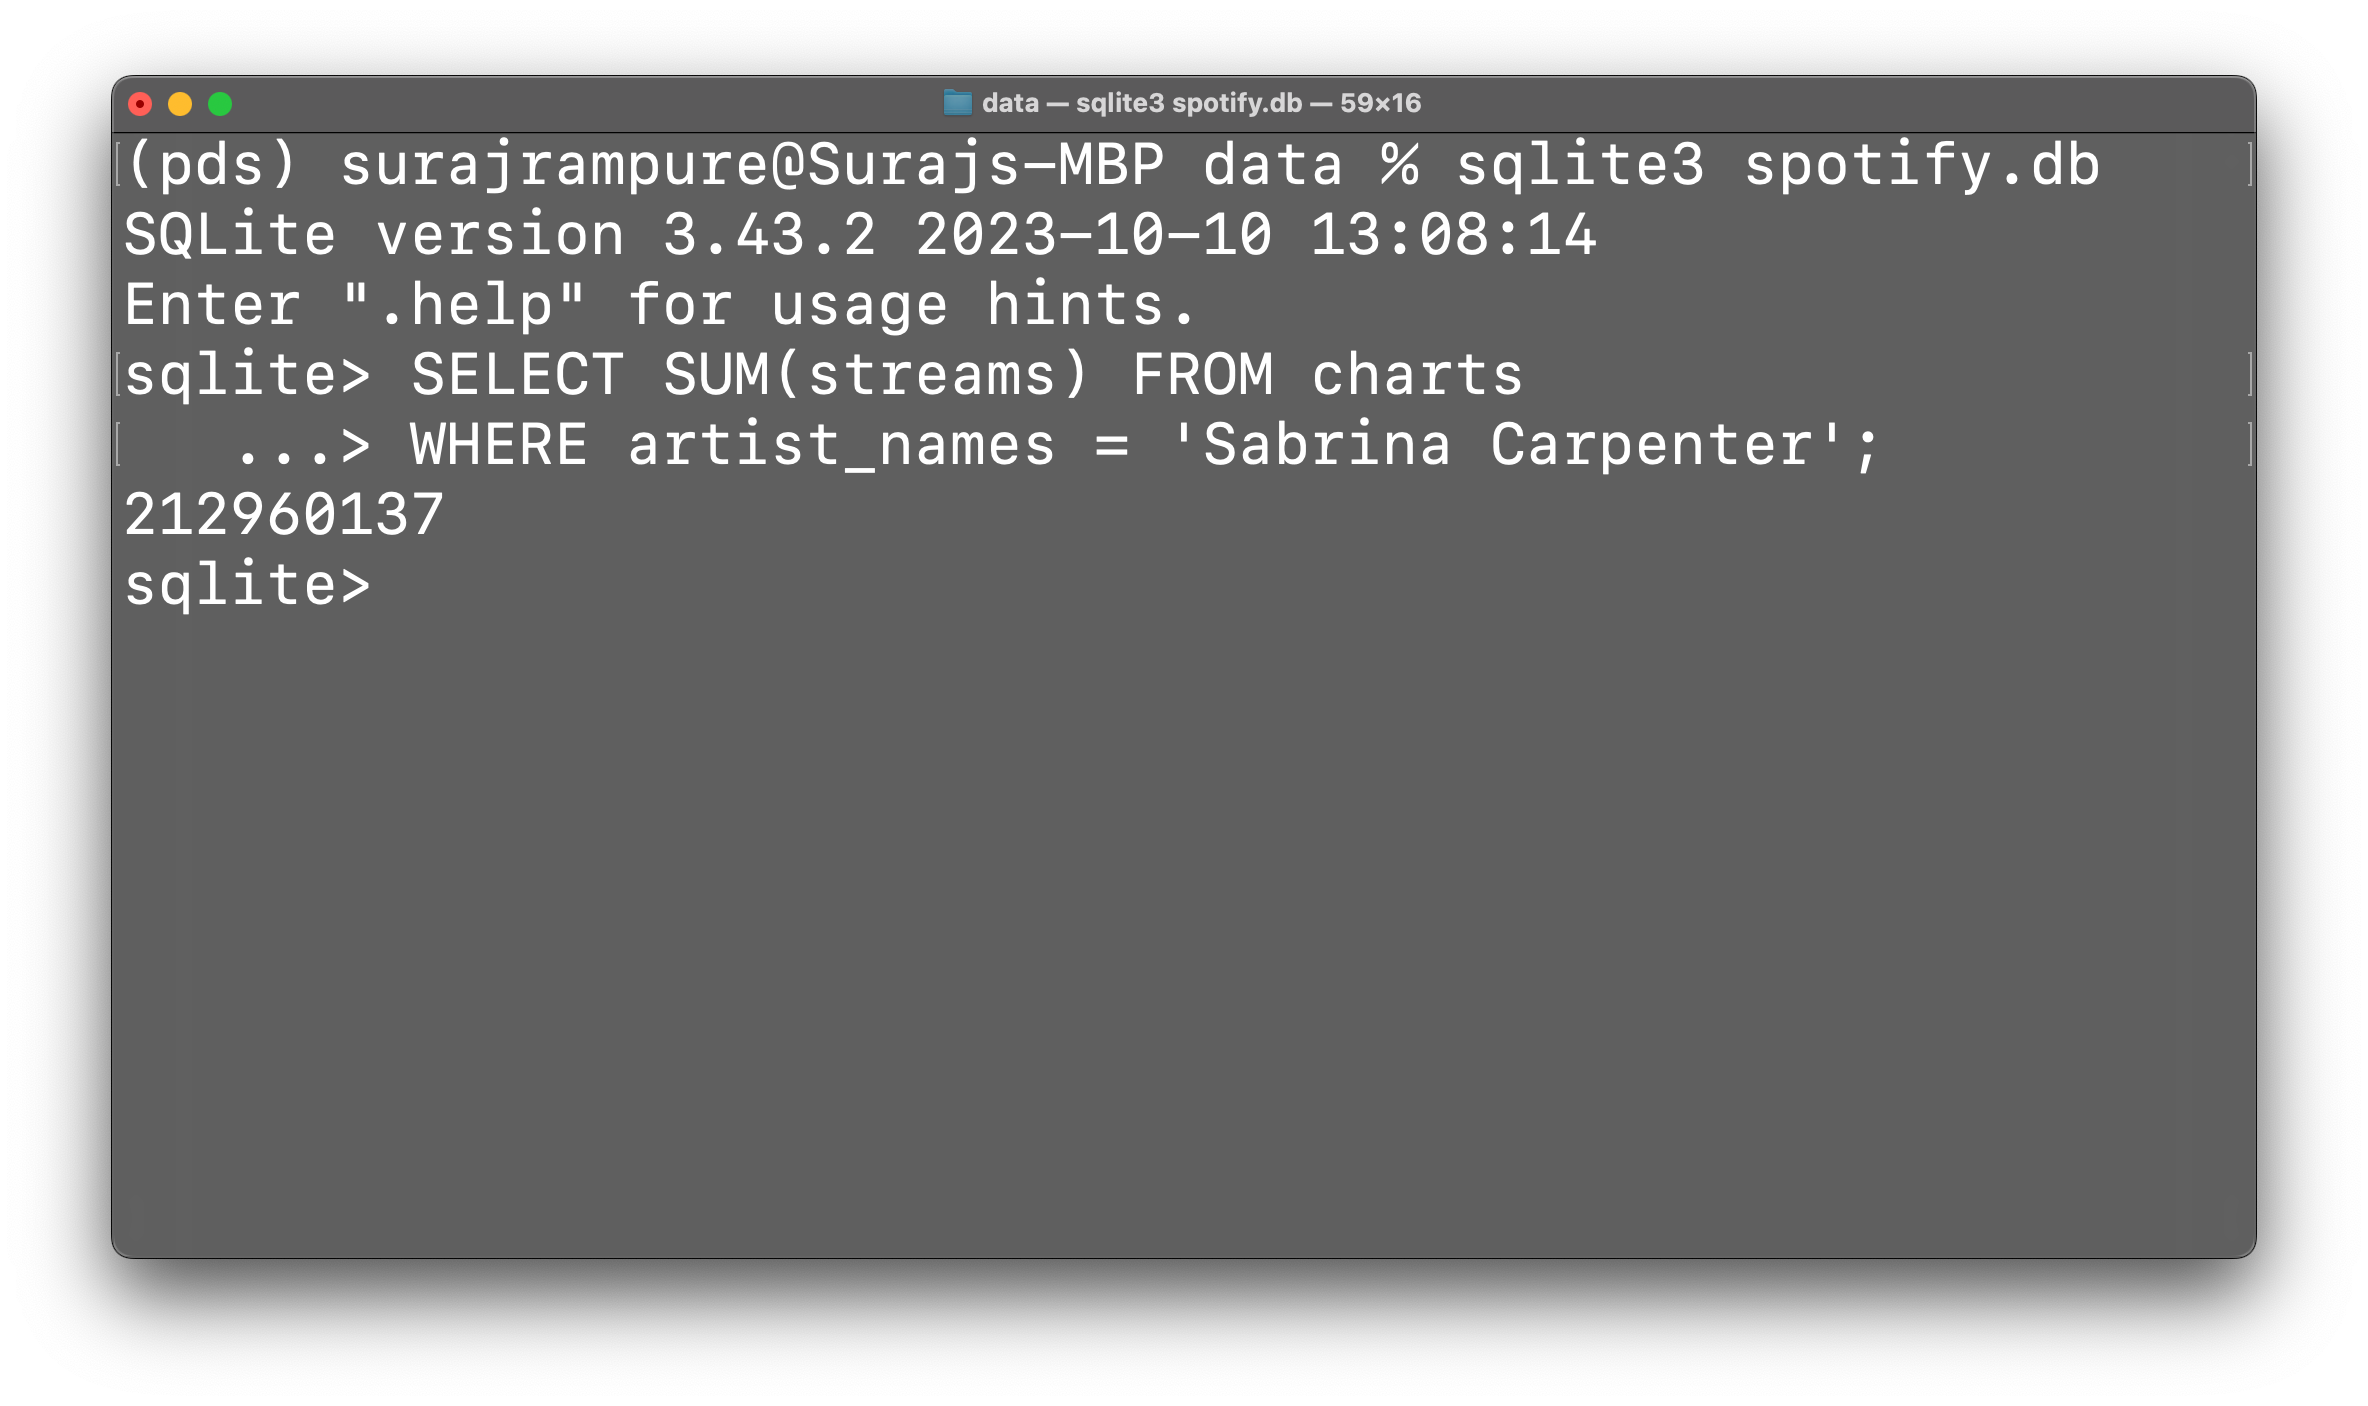
task_1
212960137
Complete using SQL.
Task 2: Find the total number of streams per artist, sorted by number of streams in descending order. Only show the top 5 artists.
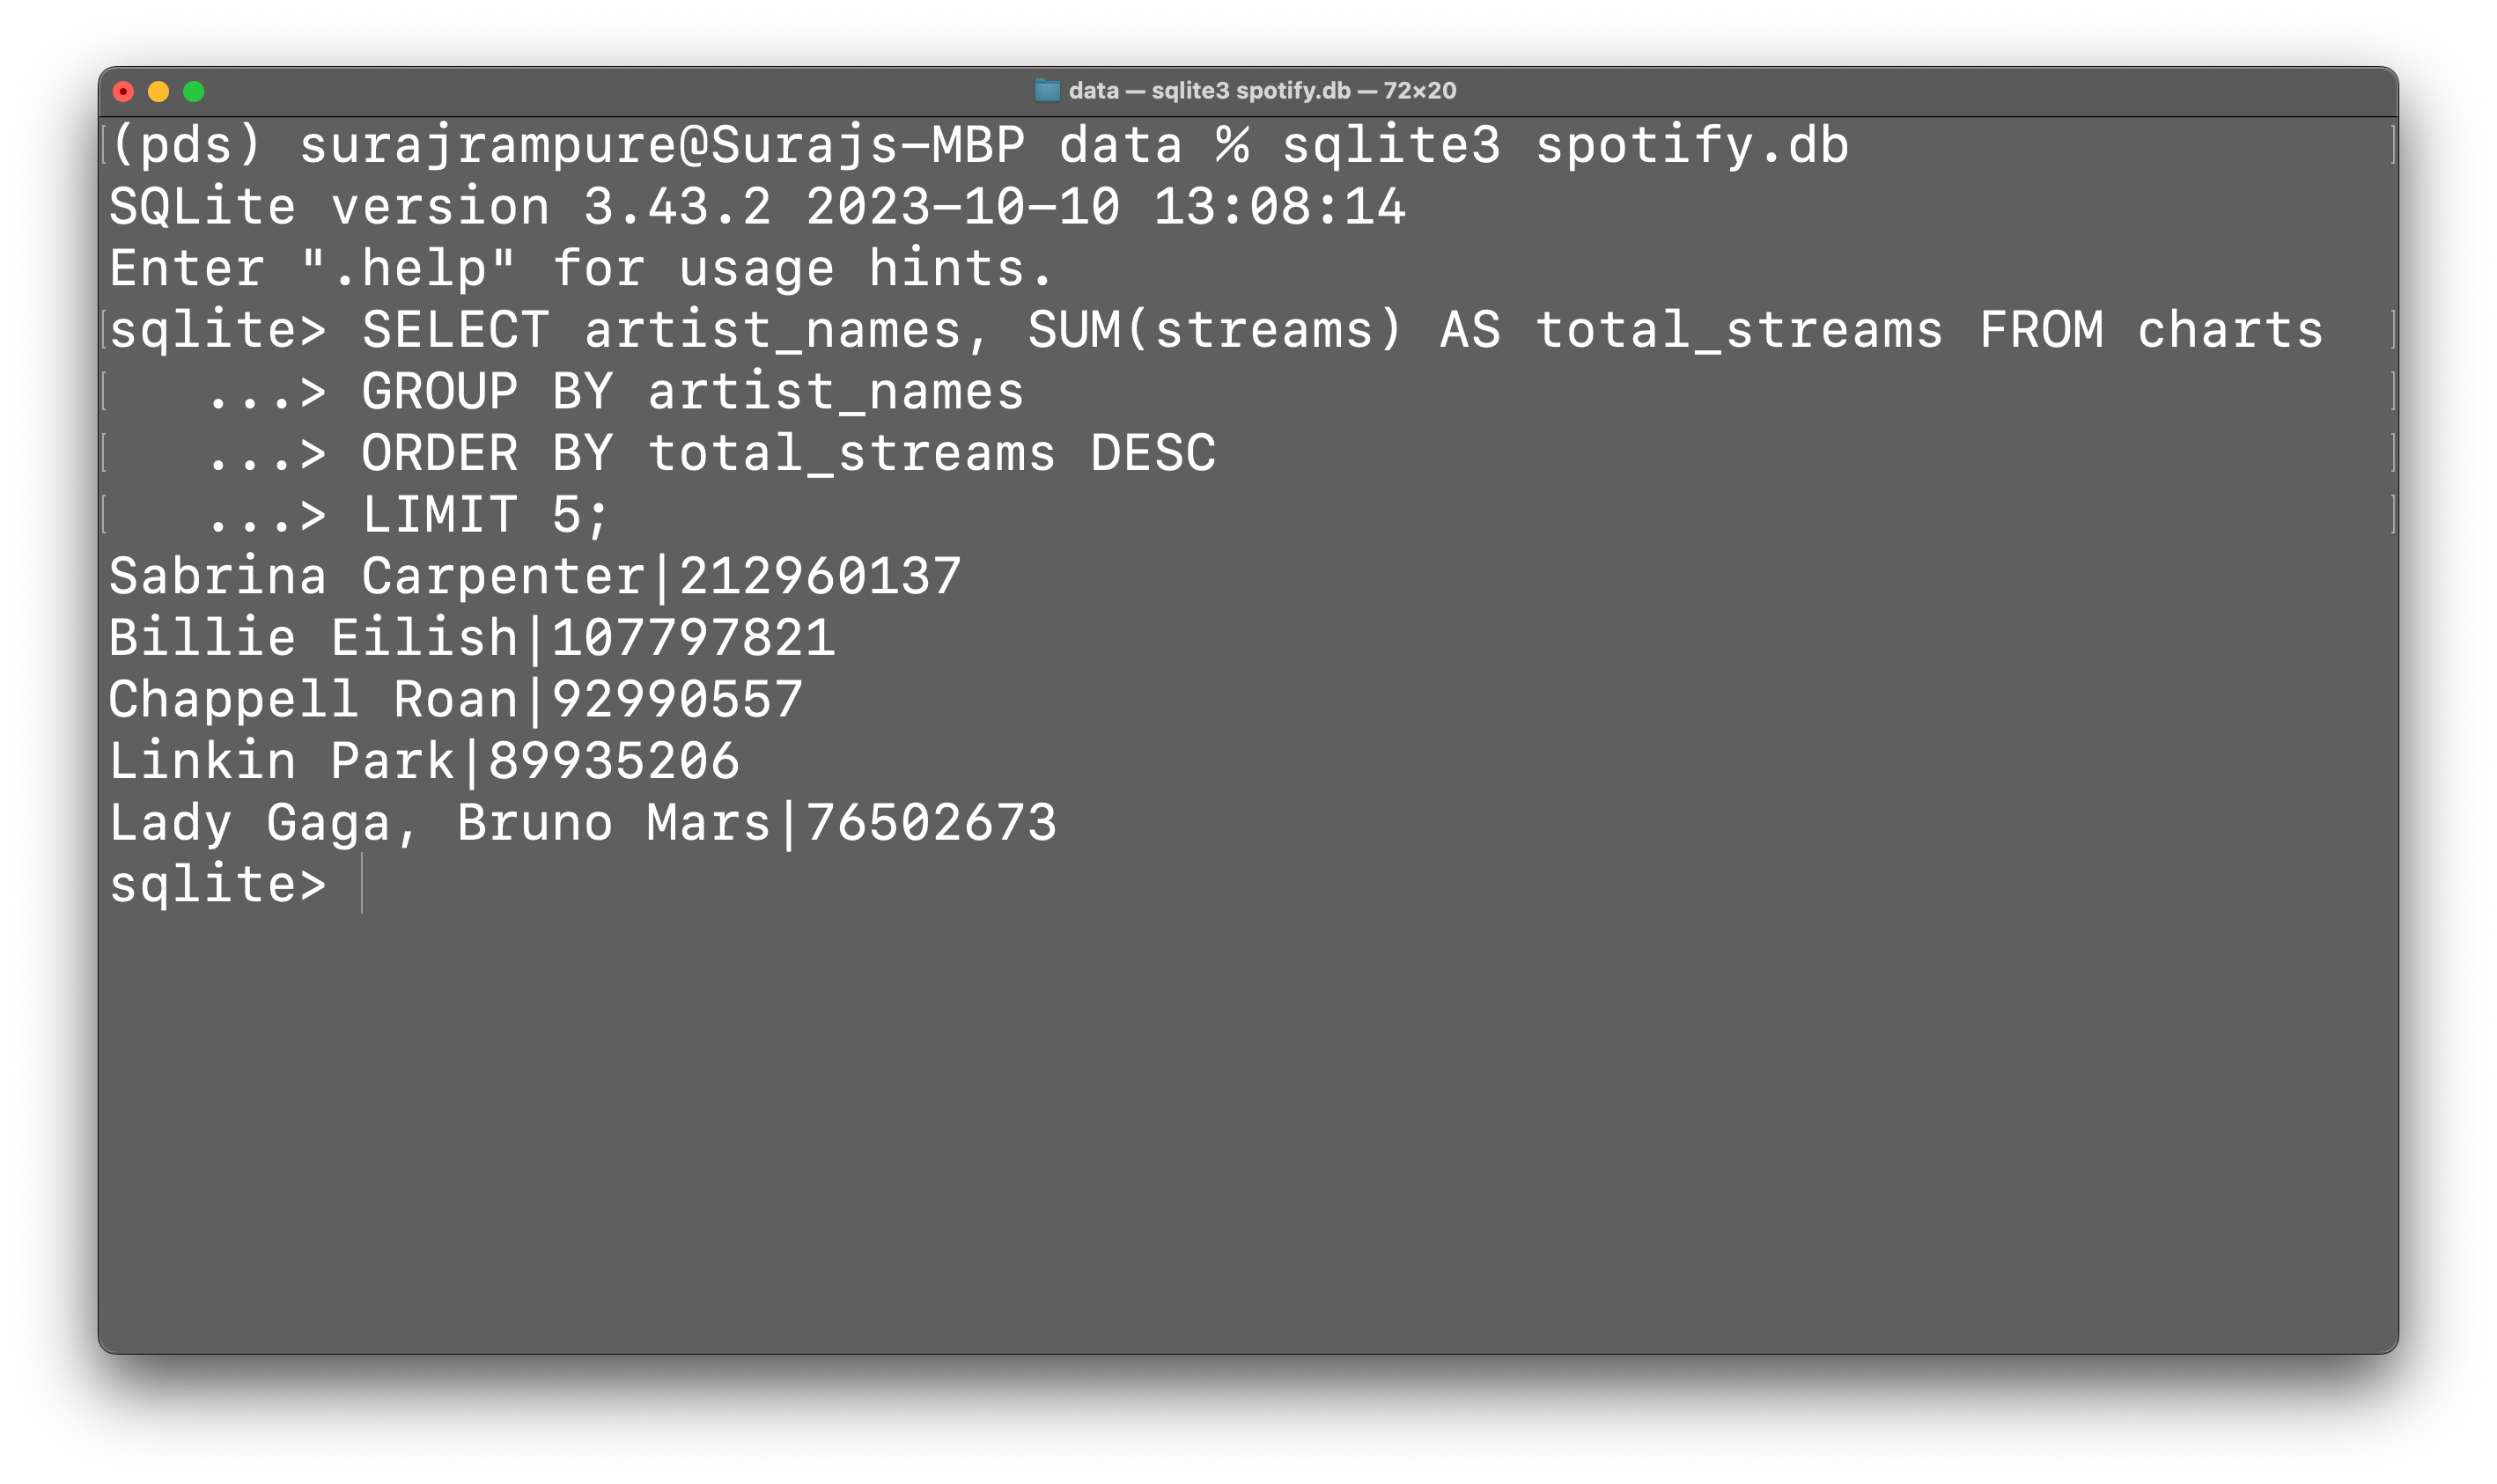
task_2
artist_names
Sabrina Carpenter        212960137
Billie Eilish            107797821
Chappell Roan             92990557
Linkin Park               89935206
Lady Gaga, Bruno Mars     76502673
Name: streams, dtype: int64
Aside: DuckDB
- Instead of having to run all of our SQL queries in the Terminal using a
.dbfile, we can use DuckDB, which allows us to execute queries in a notebook using apandasDataFrame!
- To use DuckDB,
pip installit:
!pip install duckdb
Requirement already satisfied: duckdb in /Users/surajrampure/miniforge3/envs/pds/lib/python3.10/site-packages (1.1.1)
import duckdb
- Then, use the
run_sqlfunction, defined below, to execute SQL queries using the DataFrames in our notebook as SQL tables.
def run_sql(query_str, as_df=False):
    out = duckdb.query(query_str)
    if as_df:
        return out.to_df()
    else:
        return out
run_sql('''
SELECT artist_names, SUM(streams) AS total_streams FROM charts
GROUP BY artist_names
ORDER BY total_streams DESC
LIMIT 5;
''')
┌───────────────────────┬───────────────┐
│     artist_names      │ total_streams │
│        varchar        │    int128     │
├───────────────────────┼───────────────┤
│ Sabrina Carpenter     │     212960137 │
│ Billie Eilish         │     107797821 │
│ Chappell Roan         │      92990557 │
│ Linkin Park           │      89935206 │
│ Lady Gaga, Bruno Mars │      76502673 │
└───────────────────────┴───────────────┘
- We can even ask for the output back as a DataFrame!
This means that you can combine both SQL operations andpandasoperations.
run_sql('''
SELECT artist_names, SUM(streams) AS total_streams FROM charts
GROUP BY artist_names
ORDER BY total_streams DESC
LIMIT 5;
''', as_df=True)
| artist_names | total_streams | |
|---|---|---|
| 0 | Sabrina Carpenter | 2.13e+08 |
| 1 | Billie Eilish | 1.08e+08 |
| 2 | Chappell Roan | 9.30e+07 |
| 3 | Linkin Park | 8.99e+07 |
| 4 | Lady Gaga, Bruno Mars | 7.65e+07 |
Complete using SQL.
Task 3: Find the artist with the lowest average number of streams, among artists with at least 5 songs in the Top 200.
run_sql('''
SELECT artist_names, AVG(streams) as avg_streams FROM charts
GROUP BY artist_names
HAVING COUNT(*) >= 5
ORDER BY avg_streams
LIMIT 1;
''')
┌──────────────┬─────────────┐
│ artist_names │ avg_streams │
│   varchar    │   double    │
├──────────────┼─────────────┤
│ Bruno Mars   │  12411488.8 │
└──────────────┴─────────────┘
task_3
artist_names
Bruno Mars    1.24e+07
Name: streams, dtype: float64
Complete using SQL.
Task 4: Find the number of songs with a higher ranking this week than last week.
run_sql('''
SELECT COUNT(*) as num_songs FROM (
    SELECT * FROM charts
    WHERE rank > previous_rank
)
''')
┌───────────┐
│ num_songs │
│   int64   │
├───────────┤
│       119 │
└───────────┘
task_4
119
Complete using SQL.
Task 5: charts_old contains the Top 200 songs in the previous week.
Find the song with the largest increase in streams between last week and this week, among songs that were in the Top 200 in both weeks.
run_sql('''
SELECT track_name, artist_names, (new_streams - old_streams) AS change
FROM (
    SELECT charts.uri,
           charts.track_name,
           charts.artist_names,
           charts.streams AS new_streams,
           charts_old.uri,
           charts_old.streams AS old_streams
    FROM charts
    INNER JOIN charts_old ON charts.uri = charts_old.uri
) AS merged
ORDER BY change DESC
LIMIT 1;
''', as_df=True)
| track_name | artist_names | change | |
|---|---|---|---|
| 0 | Good Luck, Babe! | Chappell Roan | 3217539 |
task_5
| track_name | artist_names | change | |
|---|---|---|---|
| 5 | Good Luck, Babe! | Chappell Roan | 3217539 |
Complete using SQL.
Task 6: Find the 4 songs with the most artists.
Fun fact: the syntax used in our solution doesn't exist in SQLite, but does exist in DuckDB.
run_sql('''
SELECT track_name, artist_names, array_length(str_split(artist_names, ', ')) AS num_artists
FROM charts
ORDER BY num_artists DESC
LIMIT 4;
''', as_df=True)
| track_name | artist_names | num_artists | |
|---|---|---|---|
| 0 | Move | Adam Port, Stryv, Keinemusik, Orso, Malachiii | 5 |
| 1 | Give Me Everything (feat. Nayer) | Pitbull, AFROJACK, Ne-Yo, Nayer | 4 |
| 2 | Can't Hold Us (feat. Ray Dalton) | Macklemore & Ryan Lewis, Macklemore, Ryan Lewi... | 4 |
| 3 | Type Shit | Future, Metro Boomin, Travis Scott, Playboi Carti | 4 |
task_6
| rank | uri | artist_names | track_name | ... | previous_rank | weeks_on_chart | streams | num_artists | |
|---|---|---|---|---|---|---|---|---|---|
| 45 | 46 | spotify:track:1BJJbSX6muJVF2AK7uH1x4 | Adam Port, Stryv, Keinemusik, Orso, Malachiii | Move | ... | 31 | 14 | 15987047 | 4 |
| 186 | 187 | spotify:track:22skzmqfdWrjJylampe0kt | Macklemore & Ryan Lewis, Macklemore, Ryan Lewi... | Can't Hold Us (feat. Ray Dalton) | ... | 163 | 132 | 9050984 | 3 |
| 194 | 195 | spotify:track:28drn6tQo95MRvO0jQEo5C | Future, Metro Boomin, Travis Scott, Playboi Carti | Type Shit | ... | -1 | 25 | 8942475 | 3 |
| 177 | 178 | spotify:track:4QNpBfC0zvjKqPJcyqBy9W | Pitbull, AFROJACK, Ne-Yo, Nayer | Give Me Everything (feat. Nayer) | ... | 165 | 19 | 9265696 | 3 |
4 rows × 10 columns
Google Sheets
Overview: Google Sheets
- While we're big fans of writing code in this class, in the business world, spreadsheets are (still) the most common tool for tabular data manipulation.
- Spreadsheets are great for showing information directly to someone else, and are easy to share.
- Microsoft Excel is widely popular, but Google Sheets is increasingly common as well, and you've likely used it before.
- Follow along by opening this Google Sheet and going to File > Make a copy.
Complete using Google Sheets.
Task 1: Find the total number of streams of songs by Sabrina Carpenter.
Relevant functions: FILTER, SUMIF.
task_1
212960137
Complete using Google Sheets.
Task 2: Find the total number of streams per artist, sorted by number of streams in descending order. Only show the top 5 artists.
Relevant functions: UNIQUE, SUMIF.
task_2
artist_names
Sabrina Carpenter        212960137
Billie Eilish            107797821
Chappell Roan             92990557
Linkin Park               89935206
Lady Gaga, Bruno Mars     76502673
Name: streams, dtype: int64
Complete using Google Sheets.
Task 3: Find the artist with the lowest average number of streams, among artists with at least 5 songs in the Top 200.
Relevant functions: AVERAGEIF.
task_3
artist_names
Bruno Mars    1.24e+07
Name: streams, dtype: float64
Complete using Google Sheets.
Task 4: Find the number of songs with a higher ranking this week than last week.
Relevant functions: IF.
task_4
119
Complete using Google Sheets.
Task 5: charts_old contains the Top 200 songs in the previous week.
Find the song with the largest increase in streams between last week and this week, among songs that were in the Top 200 in both weeks.
Relevant functions: FILTER.
task_5
| track_name | artist_names | change | |
|---|---|---|---|
| 5 | Good Luck, Babe! | Chappell Roan | 3217539 |
Complete using Google Sheets.
Task 6: Find the 4 songs with the most artists.
Relevant functions: SPLIT, LEN, SUBSTITUTE.
task_6
| rank | uri | artist_names | track_name | ... | previous_rank | weeks_on_chart | streams | num_artists | |
|---|---|---|---|---|---|---|---|---|---|
| 45 | 46 | spotify:track:1BJJbSX6muJVF2AK7uH1x4 | Adam Port, Stryv, Keinemusik, Orso, Malachiii | Move | ... | 31 | 14 | 15987047 | 4 |
| 186 | 187 | spotify:track:22skzmqfdWrjJylampe0kt | Macklemore & Ryan Lewis, Macklemore, Ryan Lewi... | Can't Hold Us (feat. Ray Dalton) | ... | 163 | 132 | 9050984 | 3 |
| 194 | 195 | spotify:track:28drn6tQo95MRvO0jQEo5C | Future, Metro Boomin, Travis Scott, Playboi Carti | Type Shit | ... | -1 | 25 | 8942475 | 3 |
| 177 | 178 | spotify:track:4QNpBfC0zvjKqPJcyqBy9W | Pitbull, AFROJACK, Ne-Yo, Nayer | Give Me Everything (feat. Nayer) | ... | 165 | 19 | 9265696 | 3 |
4 rows × 10 columns
Key takeaways
- The DataFrame manipulation techniques we've learned about over the past month generalize to other systems that you might be exposed to.
- In 20 years,
pandasmay not exist, but grouping, pivoting, querying, etc. are all concepts that still will be useful.
What's next?
- Next week, we'll learn how to extract information from messy, text data.
- Then, after the Midterm Exam, we'll switch our focus to machine learning!