from lec_utils import *
def show_grouping_animation():
    src = "https://docs.google.com/presentation/d/1tBaFyHseIGsX5wmE3BdNLeVHnKksQtpzLhHge8Tzly0/embed?start=false&loop=false&delayms=60000&rm=minimal"
    width = 960
    height = 509
    display(IFrame(src, width, height))
Announcements 📣
- Homework 2 is due on Thursday.
Post on Ed or
come to Office Hours for help! We're using a queue for office hours now – access it from practicaldsc.org/calendar.
study.practicaldsc.org contains our discussion worksheets (and solutions), which are made up of old exam problems. Use these problems to build your theoretical understanding of the material!
Homework 1 scores are available on Gradescope.
Agenda
- Recap: Querying.
- Adding and modifying columns.
pandasandnumpy.- Introduction to the
groupbymethod. groupby's inner workings.
Remember to follow along in lecture by accessing the "blank" lecture notebook in our public GitHub repository.
Question 🤔 (Answer at practicaldsc.org/q)
Remember that you can always ask questions anonymously at the link above!
Run the cell below to load in our dataset.
dogs = pd.read_csv('data/dogs43.csv').set_index('breed')
dogs.head()
| kind | lifetime_cost | longevity | size | weight | height | |
|---|---|---|---|---|---|---|
| breed | ||||||
| Brittany | sporting | 22589.0 | 12.92 | medium | 35.0 | 19.0 |
| Cairn Terrier | terrier | 21992.0 | 13.84 | small | 14.0 | 10.0 |
| English Cocker Spaniel | sporting | 18993.0 | 11.66 | medium | 30.0 | 16.0 |
| Cocker Spaniel | sporting | 24330.0 | 12.50 | small | 25.0 | 14.5 |
| Shetland Sheepdog | herding | 21006.0 | 12.53 | small | 22.0 | 14.5 |
Recap: Querying
- Querying is the act selecting rows in a DataFrame that satisfy certain condition(s).
We sometimes call this "filtering."
- Example: How many breeds live to be over 10 years old?
dogs[dogs['longevity'] > 10].shape[0]
32
- Example: Among all breeds with
'Retriever'in the same, which is the second tallest?
Remember, we like to format our code this way when writing long, hard-to-read lines.
(
    dogs.loc[dogs.index.str.contains('Retriever'), 'height']
    .sort_values(ascending=False)
    .iloc[1]
)
23.0
- What is the distribution of breeds
'size's among'sporting'and'working'breeds?
Remember, you need parentheses around each condition. Also, you must use the bitwise operators&and|instead of the standardandandorkeywords, as we saw in Lecture 3.
(
    dogs.loc[(dogs['kind'] == 'sporting') | (dogs['kind'] == 'working'), 'size']
    .value_counts()
)
size
large     11
medium     7
small      1
Name: count, dtype: int64
# Equivalent to the above!
(
    dogs.loc[dogs['kind'].isin(['sporting', 'working']), 'size']
    .value_counts()
)
size
large     11
medium     7
small      1
Name: count, dtype: int64
- Show me all rows for
'medium'-sized dogs.
dogs[dogs['size'] == 'medium']
| kind | lifetime_cost | longevity | size | weight | height | |
|---|---|---|---|---|---|---|
| breed | ||||||
| Brittany | sporting | 22589.0 | 12.92 | medium | 35.0 | 19.00 |
| English Cocker Spaniel | sporting | 18993.0 | 11.66 | medium | 30.0 | 16.00 |
| Siberian Husky | working | 22049.0 | 12.58 | medium | 47.5 | 21.75 |
| ... | ... | ... | ... | ... | ... | ... |
| Clumber Spaniel | sporting | 18084.0 | 10.00 | medium | 70.0 | 18.50 |
| Kerry Blue Terrier | terrier | 17240.0 | 9.40 | medium | 36.5 | 18.50 |
| Bull Terrier | terrier | 18490.0 | 10.21 | medium | 60.0 | 21.50 |
12 rows × 6 columns
- Show me all rows for
'Golden Retriever's.
Note that because we set the index to'breed'earlier, we can select rows based on dog breeds without having to query. If'breed'was instead a column, then we'd need to query to access information about a particular breed.
dogs.loc['Golden Retriever']
kind             sporting
lifetime_cost     21447.0
longevity           12.04
size               medium
weight               60.0
height              22.75
Name: Golden Retriever, dtype: object
Aside: Reference Slides
- Moving forward, I'm going to try and spend a bit less time on syntax and a bit more time on conceptual problem-solving.
- So, in each lecture, some slides will be called "Reference Slides".
- We will skip these slides during live lecture, but they'll be present in the posted lecture notebooks, so that you can look at them when working on activities in class and on discussion and homework problems.
The material in them is in-scope.
- Reference slides will appear with red headers, like this one.
There's a Reference Slide right after this slide, about the DataFramequerymethod!
The DataFrame query method is a convenient way to query, since you don't need parentheses and you can use the and and or keywords.
dogs
| kind | lifetime_cost | longevity | size | weight | height | |
|---|---|---|---|---|---|---|
| breed | ||||||
| Brittany | sporting | 22589.0 | 12.92 | medium | 35.0 | 19.0 |
| Cairn Terrier | terrier | 21992.0 | 13.84 | small | 14.0 | 10.0 |
| English Cocker Spaniel | sporting | 18993.0 | 11.66 | medium | 30.0 | 16.0 |
| ... | ... | ... | ... | ... | ... | ... |
| Bullmastiff | working | 13936.0 | 7.57 | large | 115.0 | 25.5 |
| Mastiff | working | 13581.0 | 6.50 | large | 175.0 | 30.0 |
| Saint Bernard | working | 20022.0 | 7.78 | large | 155.0 | 26.5 |
43 rows × 6 columns
dogs.query('weight < 20 and kind == "terrier"')
| kind | lifetime_cost | longevity | size | weight | height | |
|---|---|---|---|---|---|---|
| breed | ||||||
| Cairn Terrier | terrier | 21992.0 | 13.84 | small | 14.0 | 10.0 |
| Miniature Schnauzer | terrier | 20087.0 | 11.81 | small | 15.5 | 13.0 |
| Norfolk Terrier | terrier | 24308.0 | 13.07 | small | 12.0 | 9.5 |
dogs.query('kind in ["sporting", "terrier"] and lifetime_cost < 20000')
| kind | lifetime_cost | longevity | size | weight | height | |
|---|---|---|---|---|---|---|
| breed | ||||||
| English Cocker Spaniel | sporting | 18993.0 | 11.66 | medium | 30.0 | 16.0 |
| Chesapeake Bay Retriever | sporting | 16697.0 | 9.48 | large | 67.5 | 23.5 |
| Gordon Setter | sporting | 19605.0 | 11.10 | large | 62.5 | 25.0 |
| Clumber Spaniel | sporting | 18084.0 | 10.00 | medium | 70.0 | 18.5 |
| Scottish Terrier | terrier | 17525.0 | 10.69 | small | 20.0 | 10.0 |
| Kerry Blue Terrier | terrier | 17240.0 | 9.40 | medium | 36.5 | 18.5 |
| Bull Terrier | terrier | 18490.0 | 10.21 | medium | 60.0 | 21.5 |
jack = pd.DataFrame({1: ['fee', 'fi'],
                     '1': ['fo', 'fum']})
jack
| 1 | 1 | |
|---|---|---|
| 0 | fee | fo |
| 1 | fi | fum |
For each of the following pieces of code, predict what the output will be. Then, uncomment the line of code and see for yourself. We won't cover these in class, but you should try them out yourself. Here's a Pandas Tutor link to visualize these!
# jack[1]
# jack[[1]]
# jack['1']
# jack[[1, 1]]
# jack.loc[1]
# jack.loc[jack[1] == 'fo']
# jack[1, ['1', 1]]
# jack.loc[1,1]
Adding and modifying columns
Adding and modifying columns, using a copy
- To add a new column to a DataFrame, use the
assignmethod.
To change the values in a column, add a new column with the same name as the existing column.
- Like most
pandasmethods,assignreturns a new DataFrame.- Pro ✅: This doesn't inadvertently change any existing variables.
- Con ❌: It is not very space efficient, as it creates a new copy each time it is called.
dogs.assign(cost_per_year=dogs['lifetime_cost'] / dogs['longevity'])
| kind | lifetime_cost | longevity | size | weight | height | cost_per_year | |
|---|---|---|---|---|---|---|---|
| breed | |||||||
| Brittany | sporting | 22589.0 | 12.92 | medium | 35.0 | 19.0 | 1748.37 |
| Cairn Terrier | terrier | 21992.0 | 13.84 | small | 14.0 | 10.0 | 1589.02 |
| English Cocker Spaniel | sporting | 18993.0 | 11.66 | medium | 30.0 | 16.0 | 1628.90 |
| ... | ... | ... | ... | ... | ... | ... | ... |
| Bullmastiff | working | 13936.0 | 7.57 | large | 115.0 | 25.5 | 1840.95 |
| Mastiff | working | 13581.0 | 6.50 | large | 175.0 | 30.0 | 2089.38 |
| Saint Bernard | working | 20022.0 | 7.78 | large | 155.0 | 26.5 | 2573.52 |
43 rows × 7 columns
dogs
| kind | lifetime_cost | longevity | size | weight | height | |
|---|---|---|---|---|---|---|
| breed | ||||||
| Brittany | sporting | 22589.0 | 12.92 | medium | 35.0 | 19.0 |
| Cairn Terrier | terrier | 21992.0 | 13.84 | small | 14.0 | 10.0 |
| English Cocker Spaniel | sporting | 18993.0 | 11.66 | medium | 30.0 | 16.0 |
| ... | ... | ... | ... | ... | ... | ... |
| Bullmastiff | working | 13936.0 | 7.57 | large | 115.0 | 25.5 |
| Mastiff | working | 13581.0 | 6.50 | large | 175.0 | 30.0 |
| Saint Bernard | working | 20022.0 | 7.78 | large | 155.0 | 26.5 |
43 rows × 6 columns
You can also use assign when the desired column name has spaces (and other special characters) by unpacking a dictionary:
dogs.assign(**{'cost per year 💵': dogs['lifetime_cost'] / dogs['longevity']})
| kind | lifetime_cost | longevity | size | weight | height | cost per year 💵 | |
|---|---|---|---|---|---|---|---|
| breed | |||||||
| Brittany | sporting | 22589.0 | 12.92 | medium | 35.0 | 19.0 | 1748.37 |
| Cairn Terrier | terrier | 21992.0 | 13.84 | small | 14.0 | 10.0 | 1589.02 |
| English Cocker Spaniel | sporting | 18993.0 | 11.66 | medium | 30.0 | 16.0 | 1628.90 |
| ... | ... | ... | ... | ... | ... | ... | ... |
| Bullmastiff | working | 13936.0 | 7.57 | large | 115.0 | 25.5 | 1840.95 |
| Mastiff | working | 13581.0 | 6.50 | large | 175.0 | 30.0 | 2089.38 |
| Saint Bernard | working | 20022.0 | 7.78 | large | 155.0 | 26.5 | 2573.52 |
43 rows × 7 columns
Adding and modifying columns, in-place
- You can assign a new column to a DataFrame in-place using
[].
This works like dictionary assignment. Using[]modifies the underlying DataFrame, unlikeassign, which returns a new DataFrame.
- This is the more "common" way of adding/modifying columns.
Exercise caution when using this approach, since it is destructive – it changes the values of existing variables.
# By default, .copy() returns a deep copy of the object it is called on,
# meaning that if you change the copy, the original remains unmodified.
dogs_copy = dogs.copy()
dogs_copy.head(2)
| kind | lifetime_cost | longevity | size | weight | height | |
|---|---|---|---|---|---|---|
| breed | ||||||
| Brittany | sporting | 22589.0 | 12.92 | medium | 35.0 | 19.0 |
| Cairn Terrier | terrier | 21992.0 | 13.84 | small | 14.0 | 10.0 |
dogs_copy['cost_per_year'] = dogs_copy['lifetime_cost'] / dogs_copy['longevity']
dogs_copy
| kind | lifetime_cost | longevity | size | weight | height | cost_per_year | |
|---|---|---|---|---|---|---|---|
| breed | |||||||
| Brittany | sporting | 22589.0 | 12.92 | medium | 35.0 | 19.0 | 1748.37 |
| Cairn Terrier | terrier | 21992.0 | 13.84 | small | 14.0 | 10.0 | 1589.02 |
| English Cocker Spaniel | sporting | 18993.0 | 11.66 | medium | 30.0 | 16.0 | 1628.90 |
| ... | ... | ... | ... | ... | ... | ... | ... |
| Bullmastiff | working | 13936.0 | 7.57 | large | 115.0 | 25.5 | 1840.95 |
| Mastiff | working | 13581.0 | 6.50 | large | 175.0 | 30.0 | 2089.38 |
| Saint Bernard | working | 20022.0 | 7.78 | large | 155.0 | 26.5 | 2573.52 |
43 rows × 7 columns
- Note that we never reassigned
dogs_copyin the cell above – that is, we never wrotedogs_copy = ...– though it was still modified.
Mutability
- DataFrames, like lists, arrays, and dictionaries, are mutable. As we saw in Lecture 2, this means they can be modified in-place after creation.
- Not only does this explain the behavior on the previous slide, but it also explains the following:
dogs_copy
| kind | lifetime_cost | longevity | size | weight | height | cost_per_year | |
|---|---|---|---|---|---|---|---|
| breed | |||||||
| Brittany | sporting | 22589.0 | 12.92 | medium | 35.0 | 19.0 | 1748.37 |
| Cairn Terrier | terrier | 21992.0 | 13.84 | small | 14.0 | 10.0 | 1589.02 |
| English Cocker Spaniel | sporting | 18993.0 | 11.66 | medium | 30.0 | 16.0 | 1628.90 |
| ... | ... | ... | ... | ... | ... | ... | ... |
| Bullmastiff | working | 13936.0 | 7.57 | large | 115.0 | 25.5 | 1840.95 |
| Mastiff | working | 13581.0 | 6.50 | large | 175.0 | 30.0 | 2089.38 |
| Saint Bernard | working | 20022.0 | 7.78 | large | 155.0 | 26.5 | 2573.52 |
43 rows × 7 columns
def cost_in_thousands():
    dogs_copy['lifetime_cost'] = dogs_copy['lifetime_cost'] / 1000
# What happens when we run this twice? Three times?
cost_in_thousands()
dogs_copy
| kind | lifetime_cost | longevity | size | weight | height | cost_per_year | |
|---|---|---|---|---|---|---|---|
| breed | |||||||
| Brittany | sporting | 22.59 | 12.92 | medium | 35.0 | 19.0 | 1748.37 |
| Cairn Terrier | terrier | 21.99 | 13.84 | small | 14.0 | 10.0 | 1589.02 |
| English Cocker Spaniel | sporting | 18.99 | 11.66 | medium | 30.0 | 16.0 | 1628.90 |
| ... | ... | ... | ... | ... | ... | ... | ... |
| Bullmastiff | working | 13.94 | 7.57 | large | 115.0 | 25.5 | 1840.95 |
| Mastiff | working | 13.58 | 6.50 | large | 175.0 | 30.0 | 2089.38 |
| Saint Bernard | working | 20.02 | 7.78 | large | 155.0 | 26.5 | 2573.52 |
43 rows × 7 columns
⚠️ Warning: Avoid mutation when possible!
- Note that
dogs_copywas modified, even though we didn't reassign it! These unintended consequences can influence the behavior of test cases on homeworks, among other things!
- To avoid this, it's a good idea to avoid mutation when possible. If you must use mutation, include
df = df.copy()as the first line in functions that take DataFrames as input.
Question 🤔 (Answer at practicaldsc.org/q)
Remember that you can always ask questions anonymously at the link above!
pandas and numpy

pandas is built upon numpy!
- A Series in
pandasis anumpyarray with an index.
- A DataFrame is like a dictionary of columns, each of which is a
numpyarray.
- Many operations in
pandasare fast because they usenumpy's implementations, which are written in fast, compiled languages like C.
- If you need to access the array underlying a DataFrame or Series, use the
to_numpymethod.
dogs['lifetime_cost']
breed
Brittany                  22589.0
Cairn Terrier             21992.0
English Cocker Spaniel    18993.0
                           ...
Bullmastiff               13936.0
Mastiff                   13581.0
Saint Bernard             20022.0
Name: lifetime_cost, Length: 43, dtype: float64
dogs['lifetime_cost'].to_numpy()
array([22589., 21992., 18993., ..., 13936., 13581., 20022.])
- Each Series (column) has a
numpydata type, which refers to the type of the values stored within. Access it using thedtypesattribute.
- A column's data type determines which operations can be applied to it.
pandastries to guess the correct data types for a given DataFrame, and is often wrong.- This can lead to incorrect calculations and poor memory/time performance.
- As a result, you will often need to explicitly convert between data types.
dogs
| kind | lifetime_cost | longevity | size | weight | height | |
|---|---|---|---|---|---|---|
| breed | ||||||
| Brittany | sporting | 22589.0 | 12.92 | medium | 35.0 | 19.0 |
| Cairn Terrier | terrier | 21992.0 | 13.84 | small | 14.0 | 10.0 |
| English Cocker Spaniel | sporting | 18993.0 | 11.66 | medium | 30.0 | 16.0 |
| ... | ... | ... | ... | ... | ... | ... |
| Bullmastiff | working | 13936.0 | 7.57 | large | 115.0 | 25.5 |
| Mastiff | working | 13581.0 | 6.50 | large | 175.0 | 30.0 |
| Saint Bernard | working | 20022.0 | 7.78 | large | 155.0 | 26.5 |
43 rows × 6 columns
dogs.dtypes
kind              object
lifetime_cost    float64
longevity        float64
size              object
weight           float64
height           float64
dtype: object
- Notice that Python
strtypes areobjecttypes innumpyandpandas.
| Pandas dtype | Python type | NumPy type | SQL type | Usage |
|---|---|---|---|---|
| int64 | int | int_, int8,...,int64, uint8,...,uint64 | INT, BIGINT | Integer numbers |
| float64 | float | float_, float16, float32, float64 | FLOAT | Floating point numbers |
| bool | bool | bool_ | BOOL | True/False values |
| datetime64 or Timestamp | datetime.datetime | datetime64 | DATETIME | Date and time values |
| timedelta64 or Timedelta | datetime.timedelta | timedelta64 | NA | Differences between two datetimes |
| category | NA | NA | ENUM | Finite list of text values |
| object | str | string, unicode | NA | Text |
| object | NA | object | NA | Mixed types |
- This article details how
pandasstores different data types under the hood.
- This article explains how
numpy/pandasint64operations differ from vanillaintoperations.
- You can change the data type of a Series using the
.astypeSeries method.
- For example, we can change the data type of the
'lifetime_cost'column indogsto beuint32:
dogs
| kind | lifetime_cost | longevity | size | weight | height | |
|---|---|---|---|---|---|---|
| breed | ||||||
| Brittany | sporting | 22589.0 | 12.92 | medium | 35.0 | 19.0 |
| Cairn Terrier | terrier | 21992.0 | 13.84 | small | 14.0 | 10.0 |
| English Cocker Spaniel | sporting | 18993.0 | 11.66 | medium | 30.0 | 16.0 |
| ... | ... | ... | ... | ... | ... | ... |
| Bullmastiff | working | 13936.0 | 7.57 | large | 115.0 | 25.5 |
| Mastiff | working | 13581.0 | 6.50 | large | 175.0 | 30.0 |
| Saint Bernard | working | 20022.0 | 7.78 | large | 155.0 | 26.5 |
43 rows × 6 columns
# Gives the types as well as the space taken up by the DataFrame.
dogs.info()
<class 'pandas.core.frame.DataFrame'>
Index: 43 entries, Brittany to Saint Bernard
Data columns (total 6 columns):
 #   Column         Non-Null Count  Dtype
---  ------         --------------  -----
 0   kind           43 non-null     object
 1   lifetime_cost  43 non-null     float64
 2   longevity      43 non-null     float64
 3   size           43 non-null     object
 4   weight         43 non-null     float64
 5   height         43 non-null     float64
dtypes: float64(4), object(2)
memory usage: 3.4+ KB
dogs['lifetime_cost'] = dogs['lifetime_cost'].astype('uint32')
- Now, the DataFrame takes up less space! This may be insignificant in our DataFrame, but makes a difference when working with larger datasets.
dogs.info()
<class 'pandas.core.frame.DataFrame'>
Index: 43 entries, Brittany to Saint Bernard
Data columns (total 6 columns):
 #   Column         Non-Null Count  Dtype
---  ------         --------------  -----
 0   kind           43 non-null     object
 1   lifetime_cost  43 non-null     uint32
 2   longevity      43 non-null     float64
 3   size           43 non-null     object
 4   weight         43 non-null     float64
 5   height         43 non-null     float64
dtypes: float64(3), object(2), uint32(1)
memory usage: 3.2+ KB
Usually, we prefer to set the correct dtypes in read_csv, since it can help pandas load in files more quickly:
dogs_new = pd.read_csv('data/dogs43.csv', dtype={'lifetime_cost': 'uint32'})
dogs_new
| breed | kind | lifetime_cost | longevity | size | weight | height | |
|---|---|---|---|---|---|---|---|
| 0 | Brittany | sporting | 22589 | 12.92 | medium | 35.0 | 19.0 |
| 1 | Cairn Terrier | terrier | 21992 | 13.84 | small | 14.0 | 10.0 |
| 2 | English Cocker Spaniel | sporting | 18993 | 11.66 | medium | 30.0 | 16.0 |
| ... | ... | ... | ... | ... | ... | ... | ... |
| 40 | Bullmastiff | working | 13936 | 7.57 | large | 115.0 | 25.5 |
| 41 | Mastiff | working | 13581 | 6.50 | large | 175.0 | 30.0 |
| 42 | Saint Bernard | working | 20022 | 7.78 | large | 155.0 | 26.5 |
43 rows × 7 columns
dogs_new.dtypes
breed             object
kind              object
lifetime_cost     uint32
longevity        float64
size              object
weight           float64
height           float64
dtype: object
Axes
- The rows and columns of a DataFrame are both stored as Series.
- The axis specifies the direction of a slice of a DataFrame.
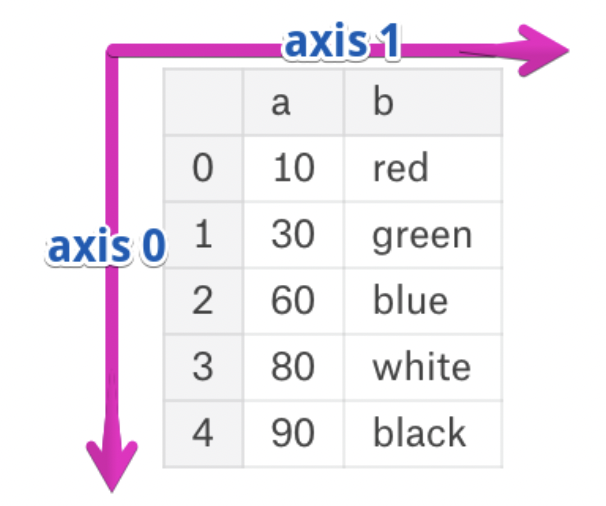
- Axis 0 refers to the rows and axis 1 refers to the columns.
These are the same axes definitions that 2Dnumpyarrays have!
DataFrame methods with axis
- Many Series methods work on DataFrames.
- In such cases, the DataFrame method usually applies the Series method to every row or column.
- Many of these methods accept an
axisargument; the default is usuallyaxis=0.
dogs
| kind | lifetime_cost | longevity | size | weight | height | |
|---|---|---|---|---|---|---|
| breed | ||||||
| Brittany | sporting | 22589 | 12.92 | medium | 35.0 | 19.0 |
| Cairn Terrier | terrier | 21992 | 13.84 | small | 14.0 | 10.0 |
| English Cocker Spaniel | sporting | 18993 | 11.66 | medium | 30.0 | 16.0 |
| ... | ... | ... | ... | ... | ... | ... |
| Bullmastiff | working | 13936 | 7.57 | large | 115.0 | 25.5 |
| Mastiff | working | 13581 | 6.50 | large | 175.0 | 30.0 |
| Saint Bernard | working | 20022 | 7.78 | large | 155.0 | 26.5 |
43 rows × 6 columns
# Max element in each column.
dogs.max()
kind             working
lifetime_cost      26686
longevity           16.5
size               small
weight             175.0
height              30.0
dtype: object
# Max element in each row – a little nonsensical, since the values in each column are on different scales.
# Note that we had to select the numeric columns first.
dogs[['lifetime_cost', 'longevity', 'weight', 'height']].max(axis=1)
breed
Brittany                  22589.0
Cairn Terrier             21992.0
English Cocker Spaniel    18993.0
                           ...
Bullmastiff               13936.0
Mastiff                   13581.0
Saint Bernard             20022.0
Length: 43, dtype: float64
# The number of unique values in each column.
dogs.nunique()
kind              7
lifetime_cost    43
longevity        40
size              3
weight           37
height           30
dtype: int64
# describe doesn't accept an axis argument; it works on every numeric column in the DataFrame it is called on.
dogs.describe()
| lifetime_cost | longevity | weight | height | |
|---|---|---|---|---|
| count | 43.00 | 43.00 | 43.00 | 43.00 |
| mean | 20532.84 | 11.34 | 49.35 | 18.34 |
| std | 3290.78 | 2.05 | 39.42 | 6.83 |
| ... | ... | ... | ... | ... |
| 50% | 21006.00 | 11.81 | 36.50 | 18.50 |
| 75% | 22072.50 | 12.52 | 67.50 | 25.00 |
| max | 26686.00 | 16.50 | 175.00 | 30.00 |
8 rows × 4 columns
Activity
Pick a dog breed that you personally like or know the name of. Then:
- Try to find a few other dog breeds that are similar in weight to yours in
all_dogs. - Which similar breeds have the lowest and highest
'lifetime_cost'?'intelligence_rank'? - Are there any similar breeds that you haven't heard of before?
For fun, look up these dog breeds on the AKC website to see what they look like!
all_dogs = pd.read_csv('data/all_dogs.csv')
all_dogs
| breed | group | datadog | popularity_all | ... | megarank | size | weight | height | |
|---|---|---|---|---|---|---|---|---|---|
| 0 | Border Collie | herding | 3.64 | 45 | ... | 29.0 | medium | NaN | 20.0 |
| 1 | Border Terrier | terrier | 3.61 | 80 | ... | 1.0 | small | 13.5 | NaN |
| 2 | Brittany | sporting | 3.54 | 30 | ... | 11.0 | medium | 35.0 | 19.0 |
| ... | ... | ... | ... | ... | ... | ... | ... | ... | ... |
| 169 | Wire Fox Terrier | terrier | NaN | 100 | ... | NaN | small | 17.5 | 15.0 |
| 170 | Wirehaired Pointing Griffon | sporting | NaN | 92 | ... | NaN | medium | NaN | 22.0 |
| 171 | Xoloitzcuintli | non-sporting | NaN | 155 | ... | NaN | medium | NaN | 16.5 |
172 rows × 18 columns
# There's no "right answer" here; you're supposed to explore!
fav_weight = all_dogs.loc[all_dogs['breed'] == 'English Cocker Spaniel', 'weight'].iloc[0]
similar_weight = all_dogs[(all_dogs['weight'] >= fav_weight - 5) & (all_dogs['weight'] <= fav_weight + 5)]
similar_weight
| breed | group | datadog | popularity_all | ... | megarank | size | weight | height | |
|---|---|---|---|---|---|---|---|---|---|
| 2 | Brittany | sporting | 3.54 | 30 | ... | 11.0 | medium | 35.0 | 19.00 |
| 5 | English Cocker Spaniel | sporting | 3.33 | 63 | ... | 5.0 | medium | 30.0 | 16.00 |
| 6 | Cocker Spaniel | sporting | 3.30 | 27 | ... | 6.0 | small | 25.0 | 14.50 |
| ... | ... | ... | ... | ... | ... | ... | ... | ... | ... |
| 125 | Irish Terrier | terrier | NaN | 132 | ... | NaN | medium | 26.0 | 18.00 |
| 138 | Norwegian Buhund | herding | NaN | 165 | ... | NaN | medium | 33.0 | 17.25 |
| 159 | Soft-Coated Wheaten Terrier | terrier | NaN | 52 | ... | NaN | medium | 35.0 | 18.00 |
12 rows × 18 columns
similar_weight.sort_values('intelligence_rank')[['breed', 'lifetime_cost', 'intelligence_rank']]
| breed | lifetime_cost | intelligence_rank | |
|---|---|---|---|
| 57 | Pembroke Welsh Corgi | 23978.0 | 11.0 |
| 5 | English Cocker Spaniel | 18993.0 | 18.0 |
| 2 | Brittany | 22589.0 | 19.0 |
| ... | ... | ... | ... |
| 73 | French Bulldog | 17266.0 | 58.0 |
| 117 | Glen of Imaal Terrier | NaN | NaN |
| 138 | Norwegian Buhund | NaN | NaN |
12 rows × 3 columns
Introduction to the groupby method
Example: Palmer Penguins
 Artwork by @allison_horst
The dataset we'll work with for the rest of the lecture involves various measurements taken of three species of penguins in Antarctica.
IFrame('https://www.youtube-nocookie.com/embed/CCrNAHXUstU?si=-DntSyUNp5Kwitjm&start=11',
       width=560, height=315)
Loading the data
penguins = sns.load_dataset('penguins').dropna().reset_index(drop=True)
penguins
| species | island | bill_length_mm | bill_depth_mm | flipper_length_mm | body_mass_g | sex | |
|---|---|---|---|---|---|---|---|
| 0 | Adelie | Torgersen | 39.1 | 18.7 | 181.0 | 3750.0 | Male |
| 1 | Adelie | Torgersen | 39.5 | 17.4 | 186.0 | 3800.0 | Female |
| 2 | Adelie | Torgersen | 40.3 | 18.0 | 195.0 | 3250.0 | Female |
| ... | ... | ... | ... | ... | ... | ... | ... |
| 330 | Gentoo | Biscoe | 50.4 | 15.7 | 222.0 | 5750.0 | Male |
| 331 | Gentoo | Biscoe | 45.2 | 14.8 | 212.0 | 5200.0 | Female |
| 332 | Gentoo | Biscoe | 49.9 | 16.1 | 213.0 | 5400.0 | Male |
333 rows × 7 columns
- Here, each row corresponds to a single penguin, and each column corresponds to a different attribute (or feature) we have for each penguin.
- Data formatted in this way is sometimes called tidy data.
Visualizing the data
penguins.plot(kind='scatter',
              x='bill_length_mm',
              y='body_mass_g',
              color='species',
              title='Body Mass vs. Bill Length')
Granularity
- Granularity refers to what each observation in a dataset represents.
- Fine: small details.
- Coarse: bigger picture.
- If you can control how your dataset is created, you should opt for finer granularity, i.e. for more detail.
- You can always remove details, but it's difficult to add detail that isn't already there.
- But obtaining fine-grained data can take more time/money.
- Today, we'll focus on how to remove details from fine-grained data, in order to help us understand bigger-picture trends in our data.
Aggregating
- Aggregating is the act of combining many values into a single value.
- What is the mean
'body_mass_g'for all penguins?
penguins['body_mass_g'].mean()
4207.057057057057
- What is the mean
'body_mass_g'for each'species'?
A naïve approach to finding the mean 'body_mass_g' per 'species'
- First, we could identify all unique values in the
'species'column.
penguins['species'].unique()
array(['Adelie', 'Chinstrap', 'Gentoo'], dtype=object)
- Then, for each
'species', we could:- Query for just that
'species'. - Extract the
'body_mass_g'column and use themeanmethod on it.
- Query for just that
penguins.loc[penguins['species'] == 'Adelie', 'body_mass_g'].mean()
3706.1643835616437
penguins.loc[penguins['species'] == 'Chinstrap', 'body_mass_g'].mean()
3733.0882352941176
penguins.loc[penguins['species'] == 'Gentoo', 'body_mass_g'].mean()
5092.436974789916
- We could use a
for-loop, but remember, we want to avoid Pythonfor-loops.
Grouping
- A better solution is to use the
groupbymethod.
# To find the overall mean 'body_mass_g':
penguins['body_mass_g'].mean()
4207.057057057057
# To find the mean 'body_mass_g' for each 'species':
penguins.groupby('species')['body_mass_g'].mean()
species
Adelie       3706.16
Chinstrap    3733.09
Gentoo       5092.44
Name: body_mass_g, dtype: float64
- Somehow, the
groupbymethod computes what we're looking for in just one line. How?
- We'll work through the internals, but remember this: if you need to calculate something for each group, use
groupby!
An illustrative example: Pets 🐱 🐶🐹
- Consider the DataFrame
pets, shown below.
| Species | Color | Weight | Age | |
|---|---|---|---|---|
| 0 | dog | black | 40 | 5.0 |
| 1 | cat | golden | 15 | 8.0 |
| 2 | cat | black | 20 | 9.0 |
| 3 | dog | white | 80 | 2.0 |
| 4 | dog | golden | 25 | 0.5 |
| 5 | hamster | golden | 1 | 3.0 |
- Let's see what happens under the hood when we use the
groupbymethod onpets.
show_grouping_animation()
Let's try it out!
pets = pd.DataFrame().assign(
    Species=['dog', 'cat', 'cat', 'dog', 'dog', 'hamster'],
    Color=['black', 'golden', 'black', 'white', 'golden', 'golden'],
    Weight=[40, 15, 20, 80, 25, 1],
    Age=[5, 8, 9, 2, 0.5, 3]
)
pets
| Species | Color | Weight | Age | |
|---|---|---|---|---|
| 0 | dog | black | 40 | 5.0 |
| 1 | cat | golden | 15 | 8.0 |
| 2 | cat | black | 20 | 9.0 |
| 3 | dog | white | 80 | 2.0 |
| 4 | dog | golden | 25 | 0.5 |
| 5 | hamster | golden | 1 | 3.0 |
# Why does this error?
pets.groupby('Species').mean()
---------------------------------------------------------------------------
TypeError                                 Traceback (most recent call last)
File ~/miniforge3/envs/pds/lib/python3.10/site-packages/pandas/core/groupby/groupby.py:1870, in GroupBy._agg_py_fallback(self, how, values, ndim, alt)
   1869 try:
-> 1870     res_values = self.grouper.agg_series(ser, alt, preserve_dtype=True)
   1871 except Exception as err:

File ~/miniforge3/envs/pds/lib/python3.10/site-packages/pandas/core/groupby/ops.py:850, in BaseGrouper.agg_series(self, obj, func, preserve_dtype)
    848     preserve_dtype = True
--> 850 result = self._aggregate_series_pure_python(obj, func)
    852 npvalues = lib.maybe_convert_objects(result, try_float=False)

File ~/miniforge3/envs/pds/lib/python3.10/site-packages/pandas/core/groupby/ops.py:871, in BaseGrouper._aggregate_series_pure_python(self, obj, func)
    870 for i, group in enumerate(splitter):
--> 871     res = func(group)
    872     res = extract_result(res)

File ~/miniforge3/envs/pds/lib/python3.10/site-packages/pandas/core/groupby/groupby.py:2376, in GroupBy.mean.<locals>.<lambda>(x)
   2373 else:
   2374     result = self._cython_agg_general(
   2375         "mean",
-> 2376         alt=lambda x: Series(x).mean(numeric_only=numeric_only),
   2377         numeric_only=numeric_only,
   2378     )
   2379     return result.__finalize__(self.obj, method="groupby")

File ~/miniforge3/envs/pds/lib/python3.10/site-packages/pandas/core/series.py:6226, in Series.mean(self, axis, skipna, numeric_only, **kwargs)
   6218 @doc(make_doc("mean", ndim=1))
   6219 def mean(
   6220     self,
   (...)
   6224     **kwargs,
   6225 ):
-> 6226     return NDFrame.mean(self, axis, skipna, numeric_only, **kwargs)

File ~/miniforge3/envs/pds/lib/python3.10/site-packages/pandas/core/generic.py:11969, in NDFrame.mean(self, axis, skipna, numeric_only, **kwargs)
  11962 def mean(
  11963     self,
  11964     axis: Axis | None = 0,
   (...)
  11967     **kwargs,
  11968 ) -> Series | float:
> 11969     return self._stat_function(
  11970         "mean", nanops.nanmean, axis, skipna, numeric_only, **kwargs
  11971     )

File ~/miniforge3/envs/pds/lib/python3.10/site-packages/pandas/core/generic.py:11926, in NDFrame._stat_function(self, name, func, axis, skipna, numeric_only, **kwargs)
  11924 validate_bool_kwarg(skipna, "skipna", none_allowed=False)
> 11926 return self._reduce(
  11927     func, name=name, axis=axis, skipna=skipna, numeric_only=numeric_only
  11928 )

File ~/miniforge3/envs/pds/lib/python3.10/site-packages/pandas/core/series.py:6134, in Series._reduce(self, op, name, axis, skipna, numeric_only, filter_type, **kwds)
   6130     raise TypeError(
   6131         f"Series.{name} does not allow {kwd_name}={numeric_only} "
   6132         "with non-numeric dtypes."
   6133     )
-> 6134 return op(delegate, skipna=skipna, **kwds)

File ~/miniforge3/envs/pds/lib/python3.10/site-packages/pandas/core/nanops.py:147, in bottleneck_switch.__call__.<locals>.f(values, axis, skipna, **kwds)
    146 else:
--> 147     result = alt(values, axis=axis, skipna=skipna, **kwds)
    149 return result

File ~/miniforge3/envs/pds/lib/python3.10/site-packages/pandas/core/nanops.py:404, in _datetimelike_compat.<locals>.new_func(values, axis, skipna, mask, **kwargs)
    402     mask = isna(values)
--> 404 result = func(values, axis=axis, skipna=skipna, mask=mask, **kwargs)
    406 if datetimelike:

File ~/miniforge3/envs/pds/lib/python3.10/site-packages/pandas/core/nanops.py:720, in nanmean(values, axis, skipna, mask)
    719 the_sum = values.sum(axis, dtype=dtype_sum)
--> 720 the_sum = _ensure_numeric(the_sum)
    722 if axis is not None and getattr(the_sum, "ndim", False):

File ~/miniforge3/envs/pds/lib/python3.10/site-packages/pandas/core/nanops.py:1693, in _ensure_numeric(x)
   1691 if isinstance(x, str):
   1692     # GH#44008, GH#36703 avoid casting e.g. strings to numeric
-> 1693     raise TypeError(f"Could not convert string '{x}' to numeric")
   1694 try:

TypeError: Could not convert string 'goldenblack' to numeric

The above exception was the direct cause of the following exception:

TypeError                                 Traceback (most recent call last)
Cell In[60], line 2
      1 # Why does this error?
----> 2 pets.groupby('Species').mean()

File ~/miniforge3/envs/pds/lib/python3.10/site-packages/pandas/core/groupby/groupby.py:2374, in GroupBy.mean(self, numeric_only, engine, engine_kwargs)
   2367     return self._numba_agg_general(
   2368         grouped_mean,
   2369         executor.float_dtype_mapping,
   2370         engine_kwargs,
   2371         min_periods=0,
   2372     )
   2373 else:
-> 2374     result = self._cython_agg_general(
   2375         "mean",
   2376         alt=lambda x: Series(x).mean(numeric_only=numeric_only),
   2377         numeric_only=numeric_only,
   2378     )
   2379     return result.__finalize__(self.obj, method="groupby")

File ~/miniforge3/envs/pds/lib/python3.10/site-packages/pandas/core/groupby/groupby.py:1925, in GroupBy._cython_agg_general(self, how, alt, numeric_only, min_count, **kwargs)
   1922     result = self._agg_py_fallback(how, values, ndim=data.ndim, alt=alt)
   1923     return result
-> 1925 new_mgr = data.grouped_reduce(array_func)
   1926 res = self._wrap_agged_manager(new_mgr)
   1927 out = self._wrap_aggregated_output(res)

File ~/miniforge3/envs/pds/lib/python3.10/site-packages/pandas/core/internals/managers.py:1428, in BlockManager.grouped_reduce(self, func)
   1424 if blk.is_object:
   1425     # split on object-dtype blocks bc some columns may raise
   1426     #  while others do not.
   1427     for sb in blk._split():
-> 1428         applied = sb.apply(func)
   1429         result_blocks = extend_blocks(applied, result_blocks)
   1430 else:

File ~/miniforge3/envs/pds/lib/python3.10/site-packages/pandas/core/internals/blocks.py:366, in Block.apply(self, func, **kwargs)
    360 @final
    361 def apply(self, func, **kwargs) -> list[Block]:
    362     """
    363     apply the function to my values; return a block if we are not
    364     one
    365     """
--> 366     result = func(self.values, **kwargs)
    368     result = maybe_coerce_values(result)
    369     return self._split_op_result(result)

File ~/miniforge3/envs/pds/lib/python3.10/site-packages/pandas/core/groupby/groupby.py:1922, in GroupBy._cython_agg_general.<locals>.array_func(values)
   1919 else:
   1920     return result
-> 1922 result = self._agg_py_fallback(how, values, ndim=data.ndim, alt=alt)
   1923 return result

File ~/miniforge3/envs/pds/lib/python3.10/site-packages/pandas/core/groupby/groupby.py:1874, in GroupBy._agg_py_fallback(self, how, values, ndim, alt)
   1872     msg = f"agg function failed [how->{how},dtype->{ser.dtype}]"
   1873     # preserve the kind of exception that raised
-> 1874     raise type(err)(msg) from err
   1876 if ser.dtype == object:
   1877     res_values = res_values.astype(object, copy=False)

TypeError: agg function failed [how->mean,dtype->object]
pets.groupby('Species')[['Weight', 'Age']].mean()
| Weight | Age | |
|---|---|---|
| Species | ||
| cat | 17.50 | 8.5 |
| dog | 48.33 | 2.5 |
| hamster | 1.00 | 3.0 |
pets.groupby('Species').max()
| Color | Weight | Age | |
|---|---|---|---|
| Species | |||
| cat | golden | 20 | 9.0 |
| dog | white | 80 | 5.0 |
| hamster | golden | 1 | 3.0 |
It takes several steps to go from the original pets DataFrame to this grouped DataFrame, but we don't get to see any of Python's inner workings, just the final output.
"Split-apply-combine" paradigm
- The
groupbymethod involves three steps: split, apply, and combine.
This is the same terminology that thepandasdocumentation uses.
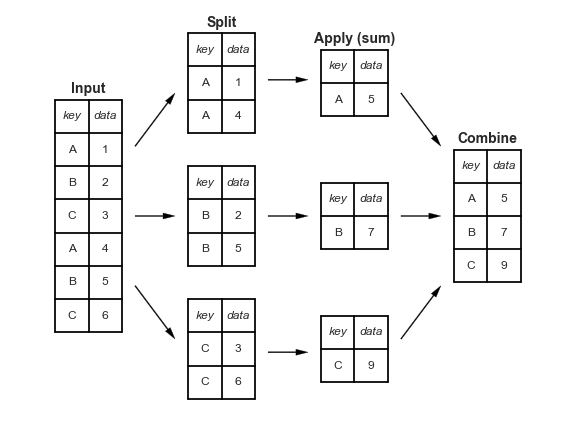
- Split breaks up and "groups" the rows of a DataFrame according to the specified key.
There is one "group" for every unique value of the key.
- Apply uses a function (e.g. aggregation, transformation, filtration) within the individual groups.
- Combine stitches the results of these operations into an output DataFrame.
- The split-apply-combine pattern can be parallelized to work on multiple computers or threads, by sending computations for each group to different processors.
More examples
Before we dive into the internals, let's look at a few more examples.
Activity
Which 'species' has the highest median 'bill_length_mm'?
(
    penguins
    .groupby('species')
    ['bill_length_mm']
    .median()
    .idxmax()
)
'Chinstrap'
(
    penguins
    .groupby('species')
    ['bill_length_mm']
    .median()
    .plot(kind='barh', title='Median Bill Length of Each Species')
)
Activity
What proportion of penguins of each 'species' live on 'Dream' island?
(
    penguins
    .assign(is_Dream=penguins['island'] == 'Dream')
    .groupby('species')
    ['is_Dream']
    .mean()
)
species
Adelie       0.38
Chinstrap    1.00
Gentoo       0.00
Name: is_Dream, dtype: float64
groupby's inner workings
How does groupby actually work?
- We've just evaluated a few expressions of the following form.
penguins.groupby('species')['bill_length_mm'].mean()
species
Adelie       38.82
Chinstrap    48.83
Gentoo       47.57
Name: bill_length_mm, dtype: float64
- There are three "building blocks"
in the above expression:
1. penguins.groupby('species').
First, we specify which column we want to group on.
1. ['bill_length_mm'].
Then, we select the other relevant columns for our calculations.
1. .mean().
Finally, we use an aggregation method.
- Let's see what each block contributes to the output.
DataFrameGroupBy objects
penguins.groupby('species')['bill_length_mm'].mean()
- If
dfis a DataFrame, thendf.groupby(key)returns aDataFrameGroupByobject.
This object represents the "split" in "split-apply-combine".
# Simplified DataFrame for demonstration:
penguins_small = penguins.iloc[[0, 150, 300, 1, 251, 151, 301], [0, 5, 6]]
penguins_small
| species | body_mass_g | sex | |
|---|---|---|---|
| 0 | Adelie | 3750.0 | Male |
| 150 | Chinstrap | 3725.0 | Male |
| 300 | Gentoo | 4875.0 | Female |
| 1 | Adelie | 3800.0 | Female |
| 251 | Gentoo | 4350.0 | Female |
| 151 | Chinstrap | 3950.0 | Female |
| 301 | Gentoo | 5550.0 | Male |
# Creates one group for each unique value in the species column.
penguins_small.groupby('species')
<pandas.core.groupby.generic.DataFrameGroupBy object at 0x309c06740>
DataFrameGroupByobjects have agroupsattribute, which is a dictionary in which the keys are group names and the values are lists of row labels.
We won't actually use this, but it's helpful in understanding howgroupbyworks under-the-hood.
penguins_small.groupby('species').groups
{'Adelie': [0, 1], 'Chinstrap': [150, 151], 'Gentoo': [300, 251, 301]}
Column extraction
penguins.groupby('species')['bill_length_mm'].mean()
- After creating a
DataFrameGroupByobject, we typically select the relevant column(s) that we want to aggregate.
- The result is either a
SeriesGroupByorDataFrameGroupByobject, depending on what's passed in.
penguins.groupby('species')['bill_length_mm']
<pandas.core.groupby.generic.SeriesGroupBy object at 0x168927400>
penguins.groupby('species')[['bill_length_mm', 'bill_depth_mm']]
<pandas.core.groupby.generic.DataFrameGroupBy object at 0x309bc25c0>
- As we've seen already, you should the columns you want to aggregate before using your aggregation method, or you may run into errors!
# This errors, because there are non-numeric columns in penguins
# that it's trying to take the "mean" of, like 'island'.
penguins.groupby('species').mean()
---------------------------------------------------------------------------
TypeError                                 Traceback (most recent call last)
File ~/miniforge3/envs/pds/lib/python3.10/site-packages/pandas/core/groupby/groupby.py:1870, in GroupBy._agg_py_fallback(self, how, values, ndim, alt)
   1869 try:
-> 1870     res_values = self.grouper.agg_series(ser, alt, preserve_dtype=True)
   1871 except Exception as err:

File ~/miniforge3/envs/pds/lib/python3.10/site-packages/pandas/core/groupby/ops.py:850, in BaseGrouper.agg_series(self, obj, func, preserve_dtype)
    848     preserve_dtype = True
--> 850 result = self._aggregate_series_pure_python(obj, func)
    852 npvalues = lib.maybe_convert_objects(result, try_float=False)

File ~/miniforge3/envs/pds/lib/python3.10/site-packages/pandas/core/groupby/ops.py:871, in BaseGrouper._aggregate_series_pure_python(self, obj, func)
    870 for i, group in enumerate(splitter):
--> 871     res = func(group)
    872     res = extract_result(res)

File ~/miniforge3/envs/pds/lib/python3.10/site-packages/pandas/core/groupby/groupby.py:2376, in GroupBy.mean.<locals>.<lambda>(x)
   2373 else:
   2374     result = self._cython_agg_general(
   2375         "mean",
-> 2376         alt=lambda x: Series(x).mean(numeric_only=numeric_only),
   2377         numeric_only=numeric_only,
   2378     )
   2379     return result.__finalize__(self.obj, method="groupby")

File ~/miniforge3/envs/pds/lib/python3.10/site-packages/pandas/core/series.py:6226, in Series.mean(self, axis, skipna, numeric_only, **kwargs)
   6218 @doc(make_doc("mean", ndim=1))
   6219 def mean(
   6220     self,
   (...)
   6224     **kwargs,
   6225 ):
-> 6226     return NDFrame.mean(self, axis, skipna, numeric_only, **kwargs)

File ~/miniforge3/envs/pds/lib/python3.10/site-packages/pandas/core/generic.py:11969, in NDFrame.mean(self, axis, skipna, numeric_only, **kwargs)
  11962 def mean(
  11963     self,
  11964     axis: Axis | None = 0,
   (...)
  11967     **kwargs,
  11968 ) -> Series | float:
> 11969     return self._stat_function(
  11970         "mean", nanops.nanmean, axis, skipna, numeric_only, **kwargs
  11971     )

File ~/miniforge3/envs/pds/lib/python3.10/site-packages/pandas/core/generic.py:11926, in NDFrame._stat_function(self, name, func, axis, skipna, numeric_only, **kwargs)
  11924 validate_bool_kwarg(skipna, "skipna", none_allowed=False)
> 11926 return self._reduce(
  11927     func, name=name, axis=axis, skipna=skipna, numeric_only=numeric_only
  11928 )

File ~/miniforge3/envs/pds/lib/python3.10/site-packages/pandas/core/series.py:6134, in Series._reduce(self, op, name, axis, skipna, numeric_only, filter_type, **kwds)
   6130     raise TypeError(
   6131         f"Series.{name} does not allow {kwd_name}={numeric_only} "
   6132         "with non-numeric dtypes."
   6133     )
-> 6134 return op(delegate, skipna=skipna, **kwds)

File ~/miniforge3/envs/pds/lib/python3.10/site-packages/pandas/core/nanops.py:147, in bottleneck_switch.__call__.<locals>.f(values, axis, skipna, **kwds)
    146 else:
--> 147     result = alt(values, axis=axis, skipna=skipna, **kwds)
    149 return result

File ~/miniforge3/envs/pds/lib/python3.10/site-packages/pandas/core/nanops.py:404, in _datetimelike_compat.<locals>.new_func(values, axis, skipna, mask, **kwargs)
    402     mask = isna(values)
--> 404 result = func(values, axis=axis, skipna=skipna, mask=mask, **kwargs)
    406 if datetimelike:

File ~/miniforge3/envs/pds/lib/python3.10/site-packages/pandas/core/nanops.py:720, in nanmean(values, axis, skipna, mask)
    719 the_sum = values.sum(axis, dtype=dtype_sum)
--> 720 the_sum = _ensure_numeric(the_sum)
    722 if axis is not None and getattr(the_sum, "ndim", False):

File ~/miniforge3/envs/pds/lib/python3.10/site-packages/pandas/core/nanops.py:1693, in _ensure_numeric(x)
   1691 if isinstance(x, str):
   1692     # GH#44008, GH#36703 avoid casting e.g. strings to numeric
-> 1693     raise TypeError(f"Could not convert string '{x}' to numeric")
   1694 try:

TypeError: Could not convert string 'TorgersenTorgersenTorgersenTorgersenTorgersenTorgersenTorgersenTorgersenTorgersenTorgersenTorgersenTorgersenTorgersenTorgersenTorgersenBiscoeBiscoeBiscoeBiscoeBiscoeBiscoeBiscoeBiscoeBiscoeBiscoeDreamDreamDreamDreamDreamDreamDreamDreamDreamDreamDreamDreamDreamDreamDreamDreamDreamDreamDreamBiscoeBiscoeBiscoeBiscoeBiscoeBiscoeBiscoeBiscoeBiscoeBiscoeBiscoeBiscoeBiscoeBiscoeBiscoeBiscoeBiscoeBiscoeTorgersenTorgersenTorgersenTorgersenTorgersenTorgersenTorgersenTorgersenTorgersenTorgersenTorgersenTorgersenTorgersenTorgersenTorgersenTorgersenDreamDreamDreamDreamDreamDreamDreamDreamDreamDreamDreamDreamDreamDreamDreamDreamBiscoeBiscoeBiscoeBiscoeBiscoeBiscoeBiscoeBiscoeBiscoeBiscoeBiscoeBiscoeBiscoeBiscoeBiscoeBiscoeTorgersenTorgersenTorgersenTorgersenTorgersenTorgersenTorgersenTorgersenTorgersenTorgersenTorgersenTorgersenTorgersenTorgersenTorgersenTorgersenDreamDreamDreamDreamDreamDreamDreamDreamDreamDreamDreamDreamDreamDreamDreamDreamDreamDreamDreamDream' to numeric

The above exception was the direct cause of the following exception:

TypeError                                 Traceback (most recent call last)
Cell In[72], line 3
      1 # This errors, because there are non-numeric columns in penguins
      2 # that it's trying to take the "mean" of, like 'island'.
----> 3 penguins.groupby('species').mean()

File ~/miniforge3/envs/pds/lib/python3.10/site-packages/pandas/core/groupby/groupby.py:2374, in GroupBy.mean(self, numeric_only, engine, engine_kwargs)
   2367     return self._numba_agg_general(
   2368         grouped_mean,
   2369         executor.float_dtype_mapping,
   2370         engine_kwargs,
   2371         min_periods=0,
   2372     )
   2373 else:
-> 2374     result = self._cython_agg_general(
   2375         "mean",
   2376         alt=lambda x: Series(x).mean(numeric_only=numeric_only),
   2377         numeric_only=numeric_only,
   2378     )
   2379     return result.__finalize__(self.obj, method="groupby")

File ~/miniforge3/envs/pds/lib/python3.10/site-packages/pandas/core/groupby/groupby.py:1925, in GroupBy._cython_agg_general(self, how, alt, numeric_only, min_count, **kwargs)
   1922     result = self._agg_py_fallback(how, values, ndim=data.ndim, alt=alt)
   1923     return result
-> 1925 new_mgr = data.grouped_reduce(array_func)
   1926 res = self._wrap_agged_manager(new_mgr)
   1927 out = self._wrap_aggregated_output(res)

File ~/miniforge3/envs/pds/lib/python3.10/site-packages/pandas/core/internals/managers.py:1428, in BlockManager.grouped_reduce(self, func)
   1424 if blk.is_object:
   1425     # split on object-dtype blocks bc some columns may raise
   1426     #  while others do not.
   1427     for sb in blk._split():
-> 1428         applied = sb.apply(func)
   1429         result_blocks = extend_blocks(applied, result_blocks)
   1430 else:

File ~/miniforge3/envs/pds/lib/python3.10/site-packages/pandas/core/internals/blocks.py:366, in Block.apply(self, func, **kwargs)
    360 @final
    361 def apply(self, func, **kwargs) -> list[Block]:
    362     """
    363     apply the function to my values; return a block if we are not
    364     one
    365     """
--> 366     result = func(self.values, **kwargs)
    368     result = maybe_coerce_values(result)
    369     return self._split_op_result(result)

File ~/miniforge3/envs/pds/lib/python3.10/site-packages/pandas/core/groupby/groupby.py:1922, in GroupBy._cython_agg_general.<locals>.array_func(values)
   1919 else:
   1920     return result
-> 1922 result = self._agg_py_fallback(how, values, ndim=data.ndim, alt=alt)
   1923 return result

File ~/miniforge3/envs/pds/lib/python3.10/site-packages/pandas/core/groupby/groupby.py:1874, in GroupBy._agg_py_fallback(self, how, values, ndim, alt)
   1872     msg = f"agg function failed [how->{how},dtype->{ser.dtype}]"
   1873     # preserve the kind of exception that raised
-> 1874     raise type(err)(msg) from err
   1876 if ser.dtype == object:
   1877     res_values = res_values.astype(object, copy=False)

TypeError: agg function failed [how->mean,dtype->object]
penguins.groupby('species')[['bill_length_mm', 'bill_depth_mm']].mean()
| bill_length_mm | bill_depth_mm | |
|---|---|---|
| species | ||
| Adelie | 38.82 | 18.35 |
| Chinstrap | 48.83 | 18.42 |
| Gentoo | 47.57 | 15.00 |
Aggregation
penguins.groupby('species')['bill_length_mm'].mean()
- Once we create a
DataFrameGroupByorSeriesGroupByobject, we need to apply some function to each group, and combine the results.
- The most common operation we apply to each group is an aggregation, but we'll see examples of filtrations and transformations soon
Remember, aggregation is the act of combining many values into a single value.
- To perform an aggregation, use an aggregation method on the
DataFrameGroupByorSeriesGroupByobject, e.g..mean(),.max(), or.median().
Let's look at some examples.
penguins_small
| species | body_mass_g | sex | |
|---|---|---|---|
| 0 | Adelie | 3750.0 | Male |
| 150 | Chinstrap | 3725.0 | Male |
| 300 | Gentoo | 4875.0 | Female |
| 1 | Adelie | 3800.0 | Female |
| 251 | Gentoo | 4350.0 | Female |
| 151 | Chinstrap | 3950.0 | Female |
| 301 | Gentoo | 5550.0 | Male |
penguins_small.groupby('species')['body_mass_g'].mean()
species
Adelie       3775.0
Chinstrap    3837.5
Gentoo       4925.0
Name: body_mass_g, dtype: float64
# Note that this worked on the entire DataFrame!
# But, if all we wanted are the sums of `'body_mass_g'
# for each species, this is slower than
# penguins_small.groupby('species')['body_mass_g'].mean().
penguins_small.groupby('species').sum()
| body_mass_g | sex | |
|---|---|---|
| species | ||
| Adelie | 7550.0 | MaleFemale |
| Chinstrap | 7675.0 | MaleFemale |
| Gentoo | 14775.0 | FemaleFemaleMale |
# Often used in conjunction with sort_values.
# Remember this when you work on the activity in a few slides!
penguins_small.groupby('species').last()
| body_mass_g | sex | |
|---|---|---|
| species | ||
| Adelie | 3800.0 | Female |
| Chinstrap | 3950.0 | Female |
| Gentoo | 5550.0 | Male |
penguins_small.groupby('species').max()
| body_mass_g | sex | |
|---|---|---|
| species | ||
| Adelie | 3800.0 | Male |
| Chinstrap | 3950.0 | Male |
| Gentoo | 5550.0 | Male |
Column independence
- Within each group, the aggregation method is applied to each column independently.
penguins_small.groupby('species').max()
| body_mass_g | sex | |
|---|---|---|
| species | ||
| Adelie | 3800.0 | Male |
| Chinstrap | 3950.0 | Male |
| Gentoo | 5550.0 | Male |
- The above result is not telling us that there is a
'Male''Adelie'penguin with a'body_mass_g'of3800.0!
# This penguin is Female!
penguins_small.loc[(penguins['species'] == 'Adelie') & (penguins['body_mass_g'] == 3800.0)]
| species | body_mass_g | sex | |
|---|---|---|---|
| 1 | Adelie | 3800.0 | Female |
Activity
Find the 'species', 'island', and 'body_mass_g' of the heaviest 'Male' and 'Female' penguins in penguins (not penguins_small).
# General idea: Sort the penguibs by mass in decreasing order.
# Then, the first male penguin that appears is the heaviest male penguin,
# and the first female penguin that appears is the heaviest female penguin.
# For each sex, take the first row.
(
    penguins
    .sort_values('body_mass_g', ascending=False)
    .groupby('sex')
    .first()
)
| species | island | bill_length_mm | bill_depth_mm | flipper_length_mm | body_mass_g | |
|---|---|---|---|---|---|---|
| sex | ||||||
| Female | Gentoo | Biscoe | 45.2 | 14.8 | 212.0 | 5200.0 |
| Male | Gentoo | Biscoe | 49.2 | 15.2 | 221.0 | 6300.0 |
Beyond default aggregation methods
- There are many built-in aggregation methods.
- What if you want to apply different aggregation methods to different columns?
- What if the aggregation method you want to use doesn't already exist in
pandas?
The aggregate method
DataFrameGroupByandSeriesGroupByobjects have a generalaggregatemethod, which aggregates using one or more operations.
Remember, aggregation is the act of combining many values into a single value.
- There are many ways of using
aggregate; refer to the documentation for a comprehensive list.
Per the documentation,aggis an alias foraggregate.
- Example arguments:
- A single function.
- A list of functions.
- A dictionary mapping column names to functions.
- We've attached a Reference Slide with examples.
- How many penguins are there of each
'species', and what is the mean'body_mass_g'of each'species'?
(
    penguins
    .groupby('species')
    ['body_mass_g']
    .aggregate(['count', 'mean'])
)
| count | mean | |
|---|---|---|
| species | ||
| Adelie | 146 | 3706.16 |
| Chinstrap | 68 | 3733.09 |
| Gentoo | 119 | 5092.44 |
- What is the maximum
'bill_length_mm'of each'species', and which'island's is each'species'found on?
(
    penguins
    .groupby('species')
    .agg({'bill_length_mm': 'max', 'island': 'unique'})
)
| bill_length_mm | island | |
|---|---|---|
| species | ||
| Adelie | 46.0 | [Torgersen, Biscoe, Dream] |
| Chinstrap | 58.0 | [Dream] |
| Gentoo | 59.6 | [Biscoe] |
Activity
What is the interquartile range of the 'body_mass_g' of each 'species'?
The interquartile range of a distribution is defined as:
$$\text{75th percentile} - \text{25th percentile}$$*Hint*: Use np.percentile, and pass agg/aggregate a custom function.
# Here, the argument to agg is a function,
# which takes in a Series and returns a scalar.
def iqr(s):
    return np.percentile(s, 75) - np.percentile(s, 25)
(
    penguins
    .groupby('species')
    ['body_mass_g']
    .agg(iqr)
)
species
Adelie       637.5
Chinstrap    462.5
Gentoo       800.0
Name: body_mass_g, dtype: float64
Question 🤔 (Answer at practicaldsc.org/q)
Remember that you can always ask questions anonymously at the link above!
What questions do you have?
Split-apply-combine, revisited
- When we introduced the split-apply-combine pattern, the "apply" step involved aggregation – our final DataFrame had one row for each group.
- Instead of aggregating during the apply step, we could instead perform a filtration, in which we keep only the groups that satisfy some condition.
- Or a transformation, in which we perform operations to every value within each group.
Grouping, then filtering
- To keep only the groups that satisfy a particular condition, use the
filtermethod on aDataFrameGroupBy/SeriesGroupByobject.
Thefiltermethod takes in a function, which itself takes in a DataFrame/Series and return a single Boolean. The result is a new DataFrame/Series with only the groups for which the filter function returnedTrue.
- For example, suppose we want only the
'species'whose average'bill_length_mm'is above 39.
(
    penguins
    .groupby('species')
    .filter(lambda df: df['bill_length_mm'].mean() > 39)
)
| species | island | bill_length_mm | bill_depth_mm | flipper_length_mm | body_mass_g | sex | |
|---|---|---|---|---|---|---|---|
| 146 | Chinstrap | Dream | 46.5 | 17.9 | 192.0 | 3500.0 | Female |
| 147 | Chinstrap | Dream | 50.0 | 19.5 | 196.0 | 3900.0 | Male |
| 148 | Chinstrap | Dream | 51.3 | 19.2 | 193.0 | 3650.0 | Male |
| ... | ... | ... | ... | ... | ... | ... | ... |
| 330 | Gentoo | Biscoe | 50.4 | 15.7 | 222.0 | 5750.0 | Male |
| 331 | Gentoo | Biscoe | 45.2 | 14.8 | 212.0 | 5200.0 | Female |
| 332 | Gentoo | Biscoe | 49.9 | 16.1 | 213.0 | 5400.0 | Male |
187 rows × 7 columns
- No more
'Adelie's!
Activity
Create a new DataFrame with only the rows in penguins for popular 'species' – that is, 'species' with at least 100 penguins.
(
    penguins
    .groupby('species')
    .filter(lambda df: df.shape[0] >= 100)
)
| species | island | bill_length_mm | bill_depth_mm | flipper_length_mm | body_mass_g | sex | |
|---|---|---|---|---|---|---|---|
| 0 | Adelie | Torgersen | 39.1 | 18.7 | 181.0 | 3750.0 | Male |
| 1 | Adelie | Torgersen | 39.5 | 17.4 | 186.0 | 3800.0 | Female |
| 2 | Adelie | Torgersen | 40.3 | 18.0 | 195.0 | 3250.0 | Female |
| ... | ... | ... | ... | ... | ... | ... | ... |
| 330 | Gentoo | Biscoe | 50.4 | 15.7 | 222.0 | 5750.0 | Male |
| 331 | Gentoo | Biscoe | 45.2 | 14.8 | 212.0 | 5200.0 | Female |
| 332 | Gentoo | Biscoe | 49.9 | 16.1 | 213.0 | 5400.0 | Male |
265 rows × 7 columns
# Note that to just find the 'species' with at least 100 penguins,
# we didn't need to group:
penguins['species'].value_counts()
species
Adelie       146
Gentoo       119
Chinstrap     68
Name: count, dtype: int64
- Suppose we want to convert the
'body_mass_g'column to to z-scores (i.e. standard units):
def z_score(x):
    return (x - x.mean()) / x.std(ddof=0)
z_score(penguins['body_mass_g'])
0     -0.57
1     -0.51
2     -1.19
       ...
330    1.92
331    1.23
332    1.48
Name: body_mass_g, Length: 333, dtype: float64
- Now, what if we wanted the z-score within each group?
- To do so, we can use the
transformmethod on aDataFrameGroupByobject. Thetransformmethod takes in a function, which itself takes in a Series and returns a new Series.
- A transformation produces a DataFrame or Series of the same size – it is not an aggregation!
z_mass = (penguins
          .groupby('species')
          ['body_mass_g']
          .transform(z_score))
z_mass
0      0.10
1      0.21
2     -1.00
       ...
330    1.32
331    0.22
332    0.62
Name: body_mass_g, Length: 333, dtype: float64
penguins.assign(z_mass=z_mass)
| species | island | bill_length_mm | bill_depth_mm | flipper_length_mm | body_mass_g | sex | z_mass | |
|---|---|---|---|---|---|---|---|---|
| 0 | Adelie | Torgersen | 39.1 | 18.7 | 181.0 | 3750.0 | Male | 0.10 |
| 1 | Adelie | Torgersen | 39.5 | 17.4 | 186.0 | 3800.0 | Female | 0.21 |
| 2 | Adelie | Torgersen | 40.3 | 18.0 | 195.0 | 3250.0 | Female | -1.00 |
| ... | ... | ... | ... | ... | ... | ... | ... | ... |
| 330 | Gentoo | Biscoe | 50.4 | 15.7 | 222.0 | 5750.0 | Male | 1.32 |
| 331 | Gentoo | Biscoe | 45.2 | 14.8 | 212.0 | 5200.0 | Female | 0.22 |
| 332 | Gentoo | Biscoe | 49.9 | 16.1 | 213.0 | 5400.0 | Male | 0.62 |
333 rows × 8 columns
display_df(penguins.assign(z_mass=z_mass), rows=8)
| species | island | bill_length_mm | bill_depth_mm | flipper_length_mm | body_mass_g | sex | z_mass | |
|---|---|---|---|---|---|---|---|---|
| 0 | Adelie | Torgersen | 39.1 | 18.7 | 181.0 | 3750.0 | Male | 0.10 |
| 1 | Adelie | Torgersen | 39.5 | 17.4 | 186.0 | 3800.0 | Female | 0.21 |
| 2 | Adelie | Torgersen | 40.3 | 18.0 | 195.0 | 3250.0 | Female | -1.00 |
| 3 | Adelie | Torgersen | 36.7 | 19.3 | 193.0 | 3450.0 | Female | -0.56 |
| ... | ... | ... | ... | ... | ... | ... | ... | ... |
| 329 | Gentoo | Biscoe | 46.8 | 14.3 | 215.0 | 4850.0 | Female | -0.49 |
| 330 | Gentoo | Biscoe | 50.4 | 15.7 | 222.0 | 5750.0 | Male | 1.32 |
| 331 | Gentoo | Biscoe | 45.2 | 14.8 | 212.0 | 5200.0 | Female | 0.22 |
| 332 | Gentoo | Biscoe | 49.9 | 16.1 | 213.0 | 5400.0 | Male | 0.62 |
333 rows × 8 columns
- Note that above, penguin 340 has a larger
'body_mass_g'than penguin 0, but a lower'z_mass'.- Penguin 0 has an above average
'body_mass_g'among'Adelie'penguins. - Penguin 340 has a below average
'body_mass_g'among'Gentoo'penguins. Remember from earlier that the average'body_mass_g'of'Gentoo'penguins is much higher than for other species.
- Penguin 0 has an above average
What's next?
- Can we group on multiple columns at once?
- What does
pivot_tabledo?
- How do we combine two DataFrames with information about similar individuals?
- How do we deal with missing values?
- How do we decide which type of visualization to create?